Author's accepted manuscript
This page is the author's accepted manuscript (AAM) of a paper under peer review at Ocean Engineering (manuscript ref. OE-D-26-02685). Status: Round 1 response due 2026-05-06, all 18 reviewer comments closed. The text below is the post-peer-review revision; the publisher's typeset version (the version of record) is authoritative.
Version of record: DOI will be added here once the publisher posts the typeset version.
Shared under CC BY-NC-ND 4.0, in accordance with the publisher's author-sharing policy.
Summary¶
Full title¶
Centrifuge Assessment of Saturation and Backfill Effects on Scour-Induced Response of Offshore Wind Turbine with Tripod Suction Bucket Foundations.
One-sentence headline¶
The first centrifuge programme to measure the scour-frequency relationship for tripod suction bucket foundations under saturated conditions and after backfill — extending J1's dry-sand baseline by two operationally critical conditions and confirming that saturation alone reduces the frequency sensitivity by about 20 % relative to dry sand.
Context¶
Every existing scour experiment prepares a pristine bed and excavates once. Real offshore scour is a continuous process: storms dig the hole, quiescent periods backfill it with loose sediment of unknown stiffness. Dry-sand results (J1) underestimate the field condition in two ways simultaneously — they miss saturation-induced stiffness changes and they miss the backfill stage that follows every scour event. This paper closes both gaps in a single programme.
Research question¶
How do saturation and natural backfill modify the scour–frequency relationship for tripod suction bucket foundations, and at what scour depth does the foundation's dynamic response transition from bending-dominated to tilting-dominated behaviour?
Approach¶
Two centrifuge test series (T4, T5) at 70 g on the Gunsan 4.2 MW tripod geometry, one at medium-dense saturated No. 7 sand (T4, \(D_r = 70.2\) %) and one at loose saturated No. 7 sand (T5, \(D_r = 60.8\) %). Each series runs four progressively deeper scour stages (\(S/D = 0\) to \(\approx 0.58\)) plus a final backfill stage with No. 5 coarser sand simulating stormlag infill. Free-decay impulse, sinusoidal sweep, and square-wave excitations extract modal parameters at every stage. Extensive instrumentation (LVDTs, tri-axial accelerometers, strain gauges, pore-pressure transducers) captures the tilting-vs-bending kinematic transition.
Gap the paper closes¶
- Defensive. No centrifuge evidence existed for TSB scour sensitivity under saturated or post-backfill conditions.
- Offensive. Every scour experiment uses dry sand and excavates once; the real-world sequence of saturate → scour → backfill produces a qualitatively different stiffness trajectory that nobody has measured.
- Constructive. Supplies the saturated-sand validation data that J2 requires, the mechanism-transition observation that Paper B uses to select features, and the backfill-recovery dataset that extends the portfolio's operating envelope.
Key literature anchors¶
- Houlsby et al. (2005) — first suction caisson centrifuge programme at Bothkennar.
- S.-R. Kim et al. (2014) — tripod bucket centrifuge testing at 100 g, KAIST.
- Jalbi & Bhattacharya (2018) — predicted 5× lower scour sensitivity for multi-footing foundations.
- K.-S. Kim et al. (2025a, J1) — dry-sand centrifuge baseline this paper extends.
- Prendergast et al. (2013, 2015) — laboratory frequency–scour demonstration on piles.
Headline findings¶
- Saturation reduces the frequency-scour slope by ~20 % relative to dry sand, consistent with the \(\sqrt{\gamma_d/\gamma'} = 1.23\) effective-stress prediction.
- Backfill with coarser No. 5 sand recovers 60–80 % of pre-scour frequency, but not 100 % — confirming the SHM threshold must account for an apparent-recovery false negative.
- Kinematic transition from bending-dominated to tilting-dominated response observed abruptly at \(S/D \approx 0.5\); the transition is not a gradual morphing but a regime shift.
- Asymmetric settlement of the three buckets under nominally symmetric scour is quantified and attributed to actuator vector misalignment + tilting onset.
Limitations¶
- Uniform concentric scour geometry only — local asymmetric scour is left for future work.
- Water as pore fluid (no glycerol) means the time-scaling conflict is ignored on the assumption that PPT records confirm sub-threshold pore-pressure cycling.
- Single model scale (1:70) — prototype-scale validation is supplied by V's 32-month field data.
- Scour was excavated at 1 g then reconsolidated at 70 g, which may overestimate post-scour stiffness by 15–25 %; the paper reframes the centrifuge result as a lower bound on scour sensitivity.
Portfolio flow¶
- Consumes: J1 dry-sand baseline; Op3 pipeline for power-law comparison.
- Produces: saturated-sand power-law coefficients → J2 validation; kinematic transition data → Paper B feature selection; backfill recovery → SHM threshold calibration in V.
Status¶
Under revision (R1). Response due 2026-05-06. All 18 reviewer comments closed; cover letter drafted. See Reviews / J3 for the point-by-point tracker.
Introduction¶
Scour around offshore wind turbine foundations reduces the effective embedment and lowers the natural frequency, potentially shifting it outside the narrow 1P–3P operating band that the design targets to avoid resonance (Arany et al., 2017; Sumer and Fredsøe, 2002). Beyond frequency, scour also reduces the lateral and moment capacity of the foundation and alters the stress distribution along the tower, accelerating fatigue damage accumulation (Ma et al., 2018; Mayall, 2019). For monopile foundations, this scour–frequency relationship has been characterised through field monitoring and numerical studies since the early 2000s. For tripod suction bucket (TSB) foundations, which resist overturning through a push-pull mechanism among discrete footings (Houlsby et al., 2005; S.-R. Kim et al., 2014; Tran et al., 2017), the scour–frequency relationship has not been quantified despite their growing adoption for deeper-water sites (Houlsby, 2016; Ryu et al., 2022).
Previously, Prendergast (Prendergast et al., 2015, 2013) demonstrated through laboratory testing on an instrumented pile in sand and via one-dimensional spring models that natural frequency decreases measurably with scour depth. Mayall et al. (2020) quantified this sensitivity in flume experiments on a monopile–tower system: first-mode frequency declined by 2.6–4.8% per pile diameter of scour, while mode 2 was 4.13 times more sensitive. Field monitoring campaigns have confirmed these trends using SCADA data from operational turbines (Weijtjens et al., 2017, 2016). Mayall (2019) showed that lateral capacity changes by a factor of three over the same scour range in which frequency changes by less than 5%, suggesting that frequency alone may not capture the full extent of foundation condition change.
Multi-footing foundations have been studied less under scour. A tripod distributes lateral loads across three discrete footings through a push-pull moment couple, so its stiffness depends on the footing spacing and individual bearing capacity rather than on a single embedment length. Jalbi and Bhattacharya (2018) predicted that jacket and tripod foundations are approximately five times less sensitive to scour than monopiles, consistent with numerical studies on tripod-pile (Ma et al., 2018) and suction bucket (Cheng et al., 2024; Ngo et al., 2022) configurations. K.-S. Kim et al. (2025a) provided the first centrifuge evidence for TSB scour sensitivity, reporting 5.0–5.3% frequency decline when scour depth reached 50–60% of the bucket diameter (\(S/D = 0.5\)–\(0.6\)) in sand. However, that study was conducted in dry soil and did not include scour remediation.
The dynamic performance of jacket-type offshore wind structures under combined environmental loading has been the subject of recent studies that inform the present work. Cheng et al. (2026) examined the seismic response of tetrapod piled jacket foundations in soft-over-stiff clay deposits and reported that foundation scour amplifies the displacement demand under combined seismic and wave actions. Y. Wang et al. (2024) conducted a comparative study of tetrapod jacket systems with semi-rigid and flexible piles under environmental loads, showing that the pile-head fixity assumption materially changes both the first-mode frequency and the load-path distribution among the four foundation legs. Barrie et al. (2024) experimentally characterised the local scour mechanism around a cylindrical coastal pile foundation on sloping beds, highlighting the directional asymmetry of scour under realistic bathymetry. Y. Wang et al. (2025) numerically evaluated the dynamic performance of recommissioned offshore wind turbines under life-extension and repowering strategies and documented the role of foundation degradation in service-life extension decisions. For multi-footing bucket foundations specifically, Li et al. (2022) quantified the bearing-capacity degradation of multi-bucket jacket foundations under scour, reinforcing the observation that bucket-type footings in jacket arrangements retain a meaningful fraction of their undegraded capacity up to moderate scour depths. Taken together with the Gunsan site-specific context addressed here, these studies confirm that realistic scour evolution must be considered alongside the wind, wave, current, and seismic environmental loads that govern offshore wind foundation design.
All existing centrifuge studies on scour sensitivity of OWT foundations have been conducted in dry sand (Cabrera et al., 2012; Futai et al., 2018; Jeong et al., 2021b; Kariyawasam et al., 2020; K.-S. Kim et al., 2025a; Zhang et al., 2025). Prendergast et al. (2015) showed that the hydrodynamic added mass of water changes the natural frequency of a stiff pile by only 0.3%, suggesting that submersion itself has negligible effect. However, saturation also reduces the effective unit weight and consequently the effective stresses and small-strain stiffness throughout the soil profile, and no experiment has tested whether this alters the scour–frequency relationship for TSB foundations. Frequency-based monitoring is now used on operational turbines (Weijtjens et al., 2017), but no saturated-sand calibration data exist for multi-footing foundations.
When scour protection fails or is absent, scour remediation through backfilling becomes necessary. Mayall et al. (2020) tested remedial rock fill for monopiles in flume experiments and found that backfill partially recovers the natural frequency but does not fully restore it to the pre-scour value, because the backfill stiffness was lower than that of the in-situ sand. Foti and Sabia (2011) confirmed this on a full-scale bridge pier, noting that infill materials typically have inferior mechanical properties compared to the original ground. Sørensen and Ibsen (2013) showed numerically that the relative density of backfill material governs the magnitude of frequency recovery. More recent work on scour-mitigation materials has broadened the options: C. Wang et al. (2025) characterised the protection mechanism and failure modes of solidified soil as a scour countermeasure, and C. Wang et al. (2024) developed an artificial-intelligent flume apparatus for parametric investigation of local scour around underwater foundations. The ratio of backfill stiffness to native soil stiffness appears to control recovery, but no experiment has isolated this ratio under controlled conditions. No data on backfill effectiveness exist for TSB foundations. This is the first centrifuge programme to test scour sensitivity in saturated sand and measure backfill recovery for a multi-footing offshore wind foundation.
A series of 22 centrifuge test cases at \(70g\) across five series (T1–T5) were conducted on an OWT with a TSB foundation. The dry-sand series (T1–T3) were reported by K.-S. Kim et al. (2025a); this study reports the saturated series (T4–T5) and their backfill stages. Two saturated series were prepared in dense (T4, \(D_r = 70\%\)) and loose (T5, \(D_r = 61\%\)) silica sand, each comprising four scour stages (\(S/D = 0\) to \(0.58\)) and one backfill stage using coarser sand. In-flight miniature CPT was performed to characterise the native soil state and repeated after backfilling to quantify the backfill stiffness. Natural frequency, displacement, bending strain, and bucket settlement were measured at each stage.
Experimental Programme¶
Centrifuge Facility and Test Programme¶
All tests were conducted at a centrifugal acceleration of \(70g\) on the beam centrifuge (5.0 m effective radius, 2,400 kg capacity) in the Korea Construction Engineering Development Collaboratory Program (KOCED) Geotechnical Centrifuge Testing Center, located at Korea Advanced Institute of Science and Technology (KAIST) (Kim et al., 2013). The soil model and structural foundation were installed in a rectangular aluminium strongbox (1,400 mm \(\times\) 650 mm \(\times\) 700 mm) with walls lined with 10 mm Duxseal absorbing material to minimise stress wave reflections.
The full experimental programme comprised 22 centrifuge test cases across five series (T1–T5), summarised in Table 1. The three dry-sand series (T1–T3) were reported in K.-S. Kim et al. (2025a); the present study reports the two saturated series (T4 and T5). The five series form a structured comparison matrix: T1 (dense dry) and T4 (dense saturated) isolate the saturation effect at high density, while T2 (loose dry) and T5 (loose saturated) do the same at low density. T3 (sand–silt) provides a soil-type comparison.
Within each series, three to four progressively deeper scour stages were applied up to \(S/D \approx 0.5\)–\(0.6\), corresponding to approximately half the design scour depth at the Gunsan site. The scour increments (\(S/D \approx 0.2\), 0.4, 0.6) were chosen to span the range from negligible to moderate scour, where frequency-based monitoring is most relevant; deeper scour was not attempted to avoid undermining the suction bucket skirt tips. T4 and T5 each include a fifth test case (T4-5, T5-5) in which the maximum-scour condition was remediated by backfilling with coarser sand.
The upper bound \(S/D \approx 0.6\) warrants explicit justification because monopile scour literature routinely reports equilibrium depths up to \(S/D \approx 1\)-\(2\) (Prendergast et al., 2013; Sumer and Fredsøe, 2002). Two considerations set the relevant envelope for a tripod suction bucket foundation of the type tested here, and both point to a smaller range than the monopile literature. First, field bathymetric surveys at the Gunsan demonstration site place the design-envelope scour depth around 6-10 m around each bucket, which corresponds to \(S/D \approx 0.75\)-\(1.25\) but is achieved over the full 20-30 year service life rather than the seasonal storm-scale depths assumed in monopile design codes. Second, the tripod push-pull mechanism redistributes lateral load across three discrete footings so that the same local scour depth produces a smaller global frequency change than it would on a monopile of equivalent diameter: Jalbi and Bhattacharya (2018) reported that tripod and jacket foundations are roughly five times less sensitive to scour than a single-footing monopile, implying that the monitoring-relevant \(S/D\) band for TSB is compressed rather than stretched. Together these two facts motivate focusing the centrifuge programme on \(S/D \le 0.6\), which covers (i) the \(S/D \le 0.5\) early-warning band most relevant to structural-health-monitoring alerts, (ii) the \(S/D \approx 0.5\)-\(0.6\) transition band where the loose-sand bending-to-tilting mechanism emerges (§4.1), and (iii) a full backfill recovery stage for both dense and loose soil conditions. The deeper \(S/D > 0.7\) range that monopile studies probe would, for the tripod bucket geometry, undermine the suction-bucket skirt tips and produce a qualitatively different failure mode (kinematic collapse rather than stiffness degradation) that is outside the scope of a scour-sensitivity study and would require a different experimental set-up.
Within this programme all scour events are local: soil was removed concentrically around each of the three suction buckets, leaving the inter-bucket seabed undisturbed at its pre-test elevation. This corresponds to engineered design scour around individual footings rather than the global seabed lowering that can occur under strong far-field currents. Global scour was not simulated because it does not affect the scour-frequency relationship of a tripod foundation in the same way as local scour: global lowering removes soil uniformly from all three bucket perimeters and from the tripod substructure simultaneously, which does not concentrate stiffness reduction at the skirt tip as local scour does. The reported \(f/f_0\) sensitivity therefore applies specifically to local, per-bucket scour; a programme probing global scour would require a tilted strongbox or a lower-level excavation system and is reserved for future work.
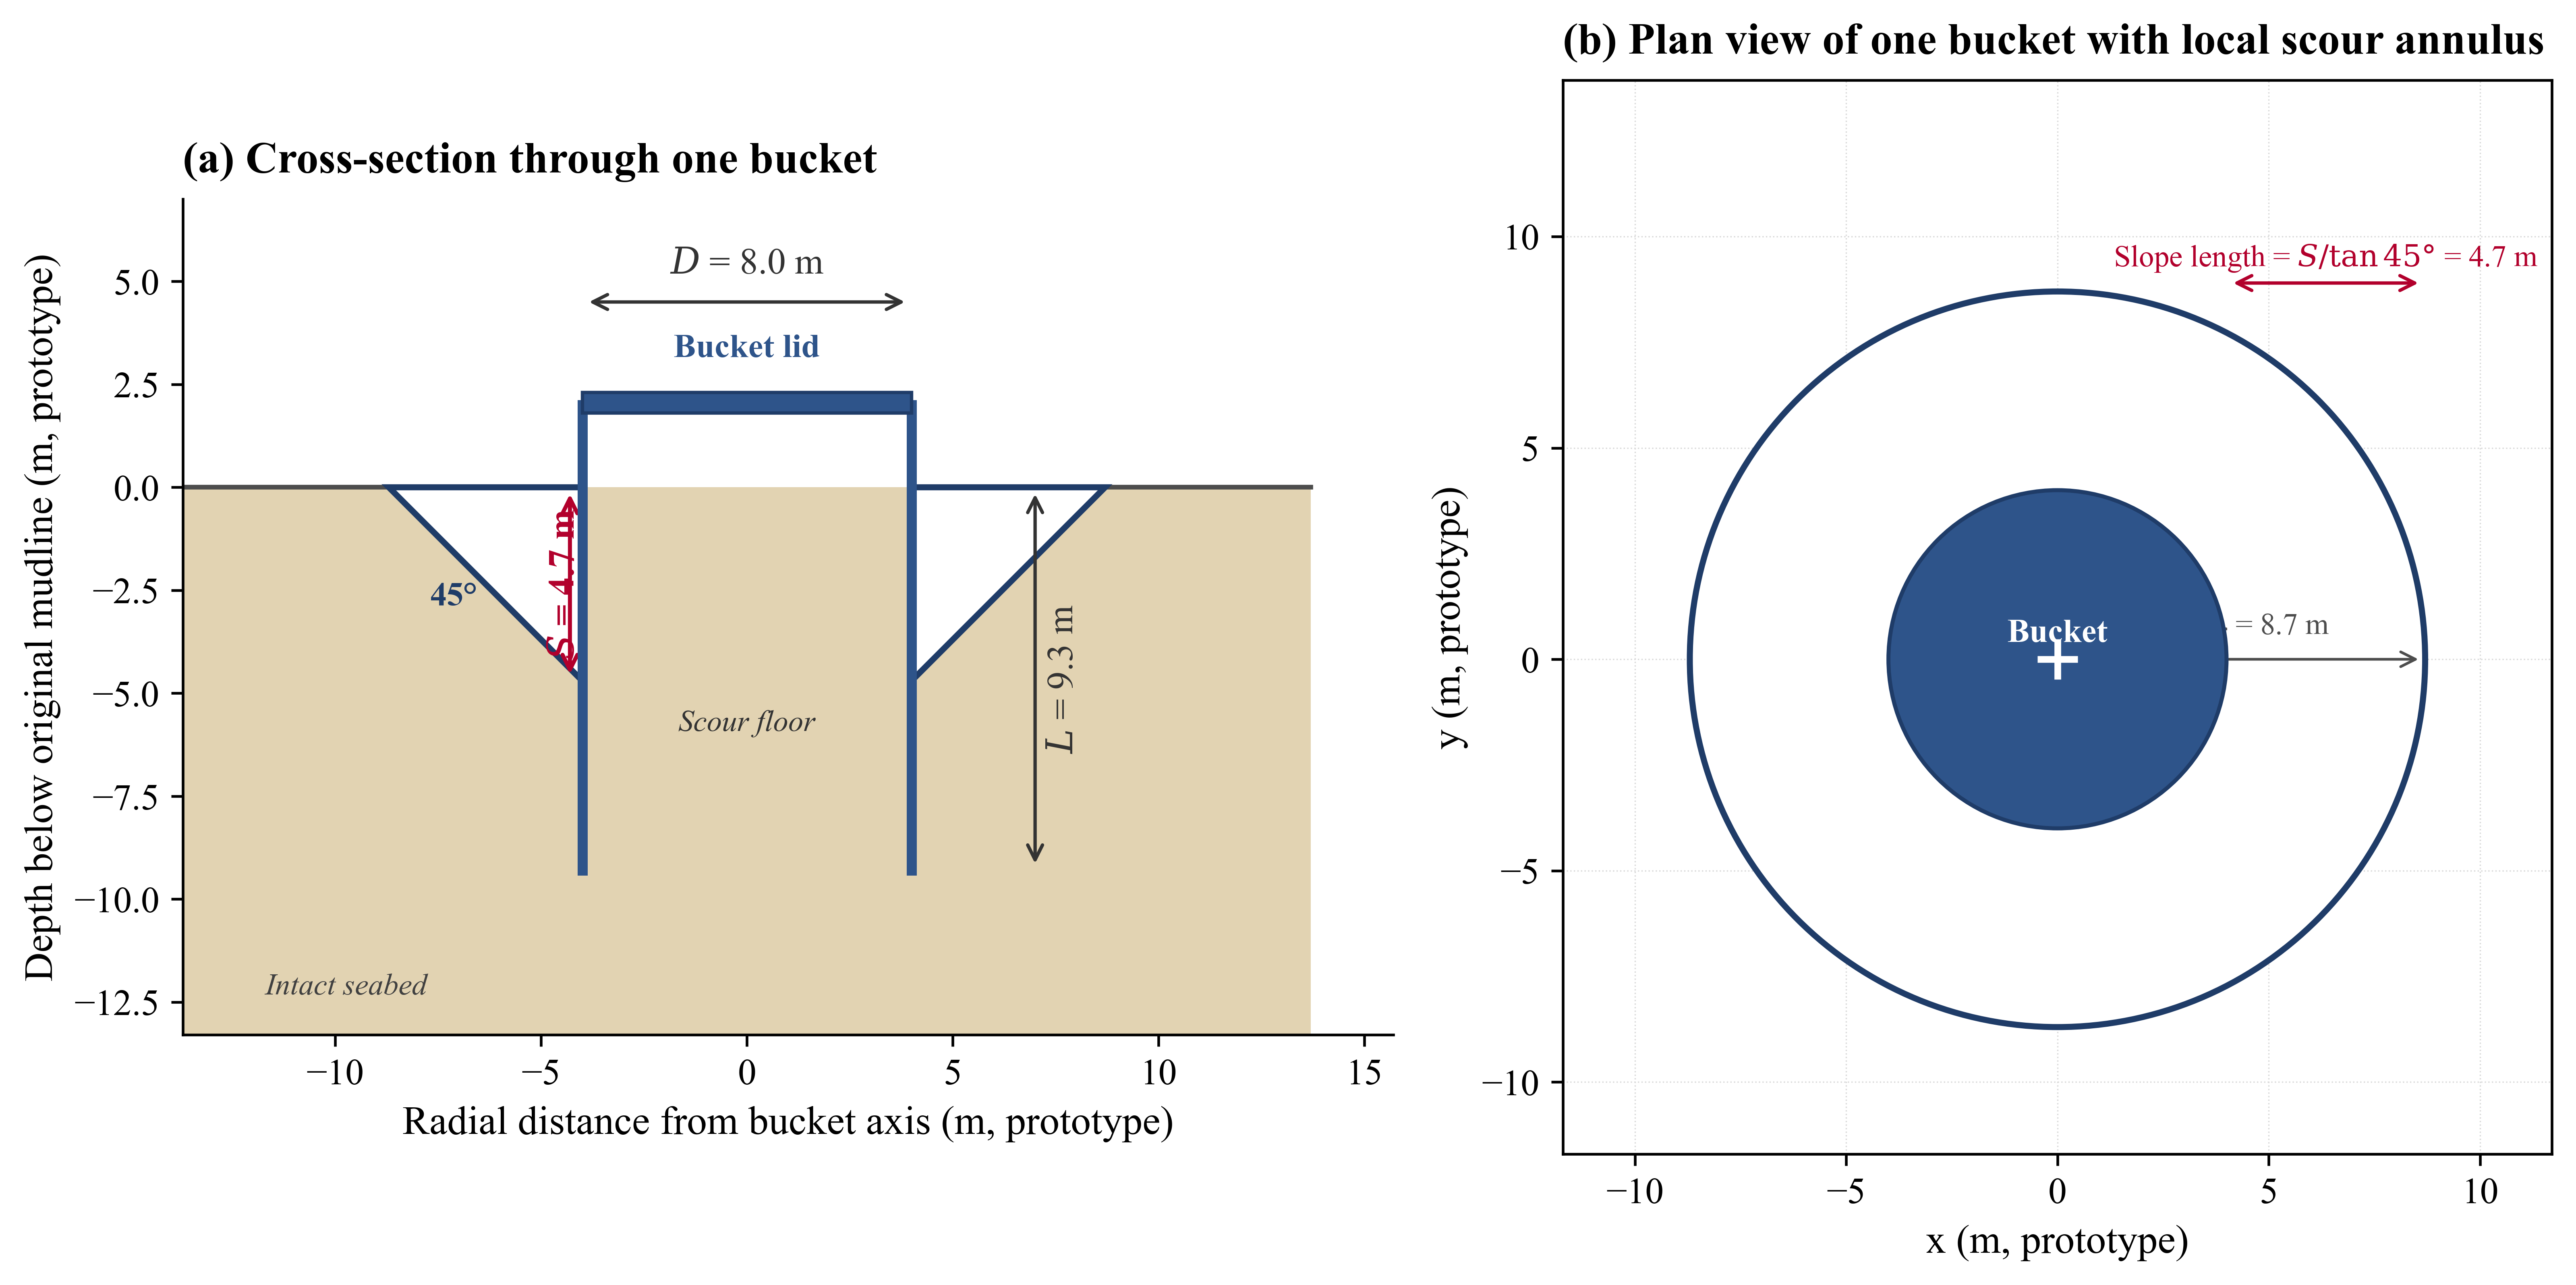
Figure 1: Shape of the local-scour hole used in this programme. (a) Cross-section through a single suction bucket: the scour geometry is a frustum with a \(45°\) side slope, inner floor radius equal to the bucket outer radius (\(D/2 = 4.0\) m at prototype), and surface outer radius \(D/2 + S / \tan 45° = D/2 + S\). Maximum test scour depth \(S = 4.7\) m corresponds to \(S/D = 0.58\). (b) Plan view of one bucket with the circular scour annulus. The same geometry is applied concentrically to all three buckets of the tripod; the three scour holes do not intersect at the maximum tested scour depth because \(r_{\mathrm{scour}} + D/2 < L_{\mathrm{base}}/2\).
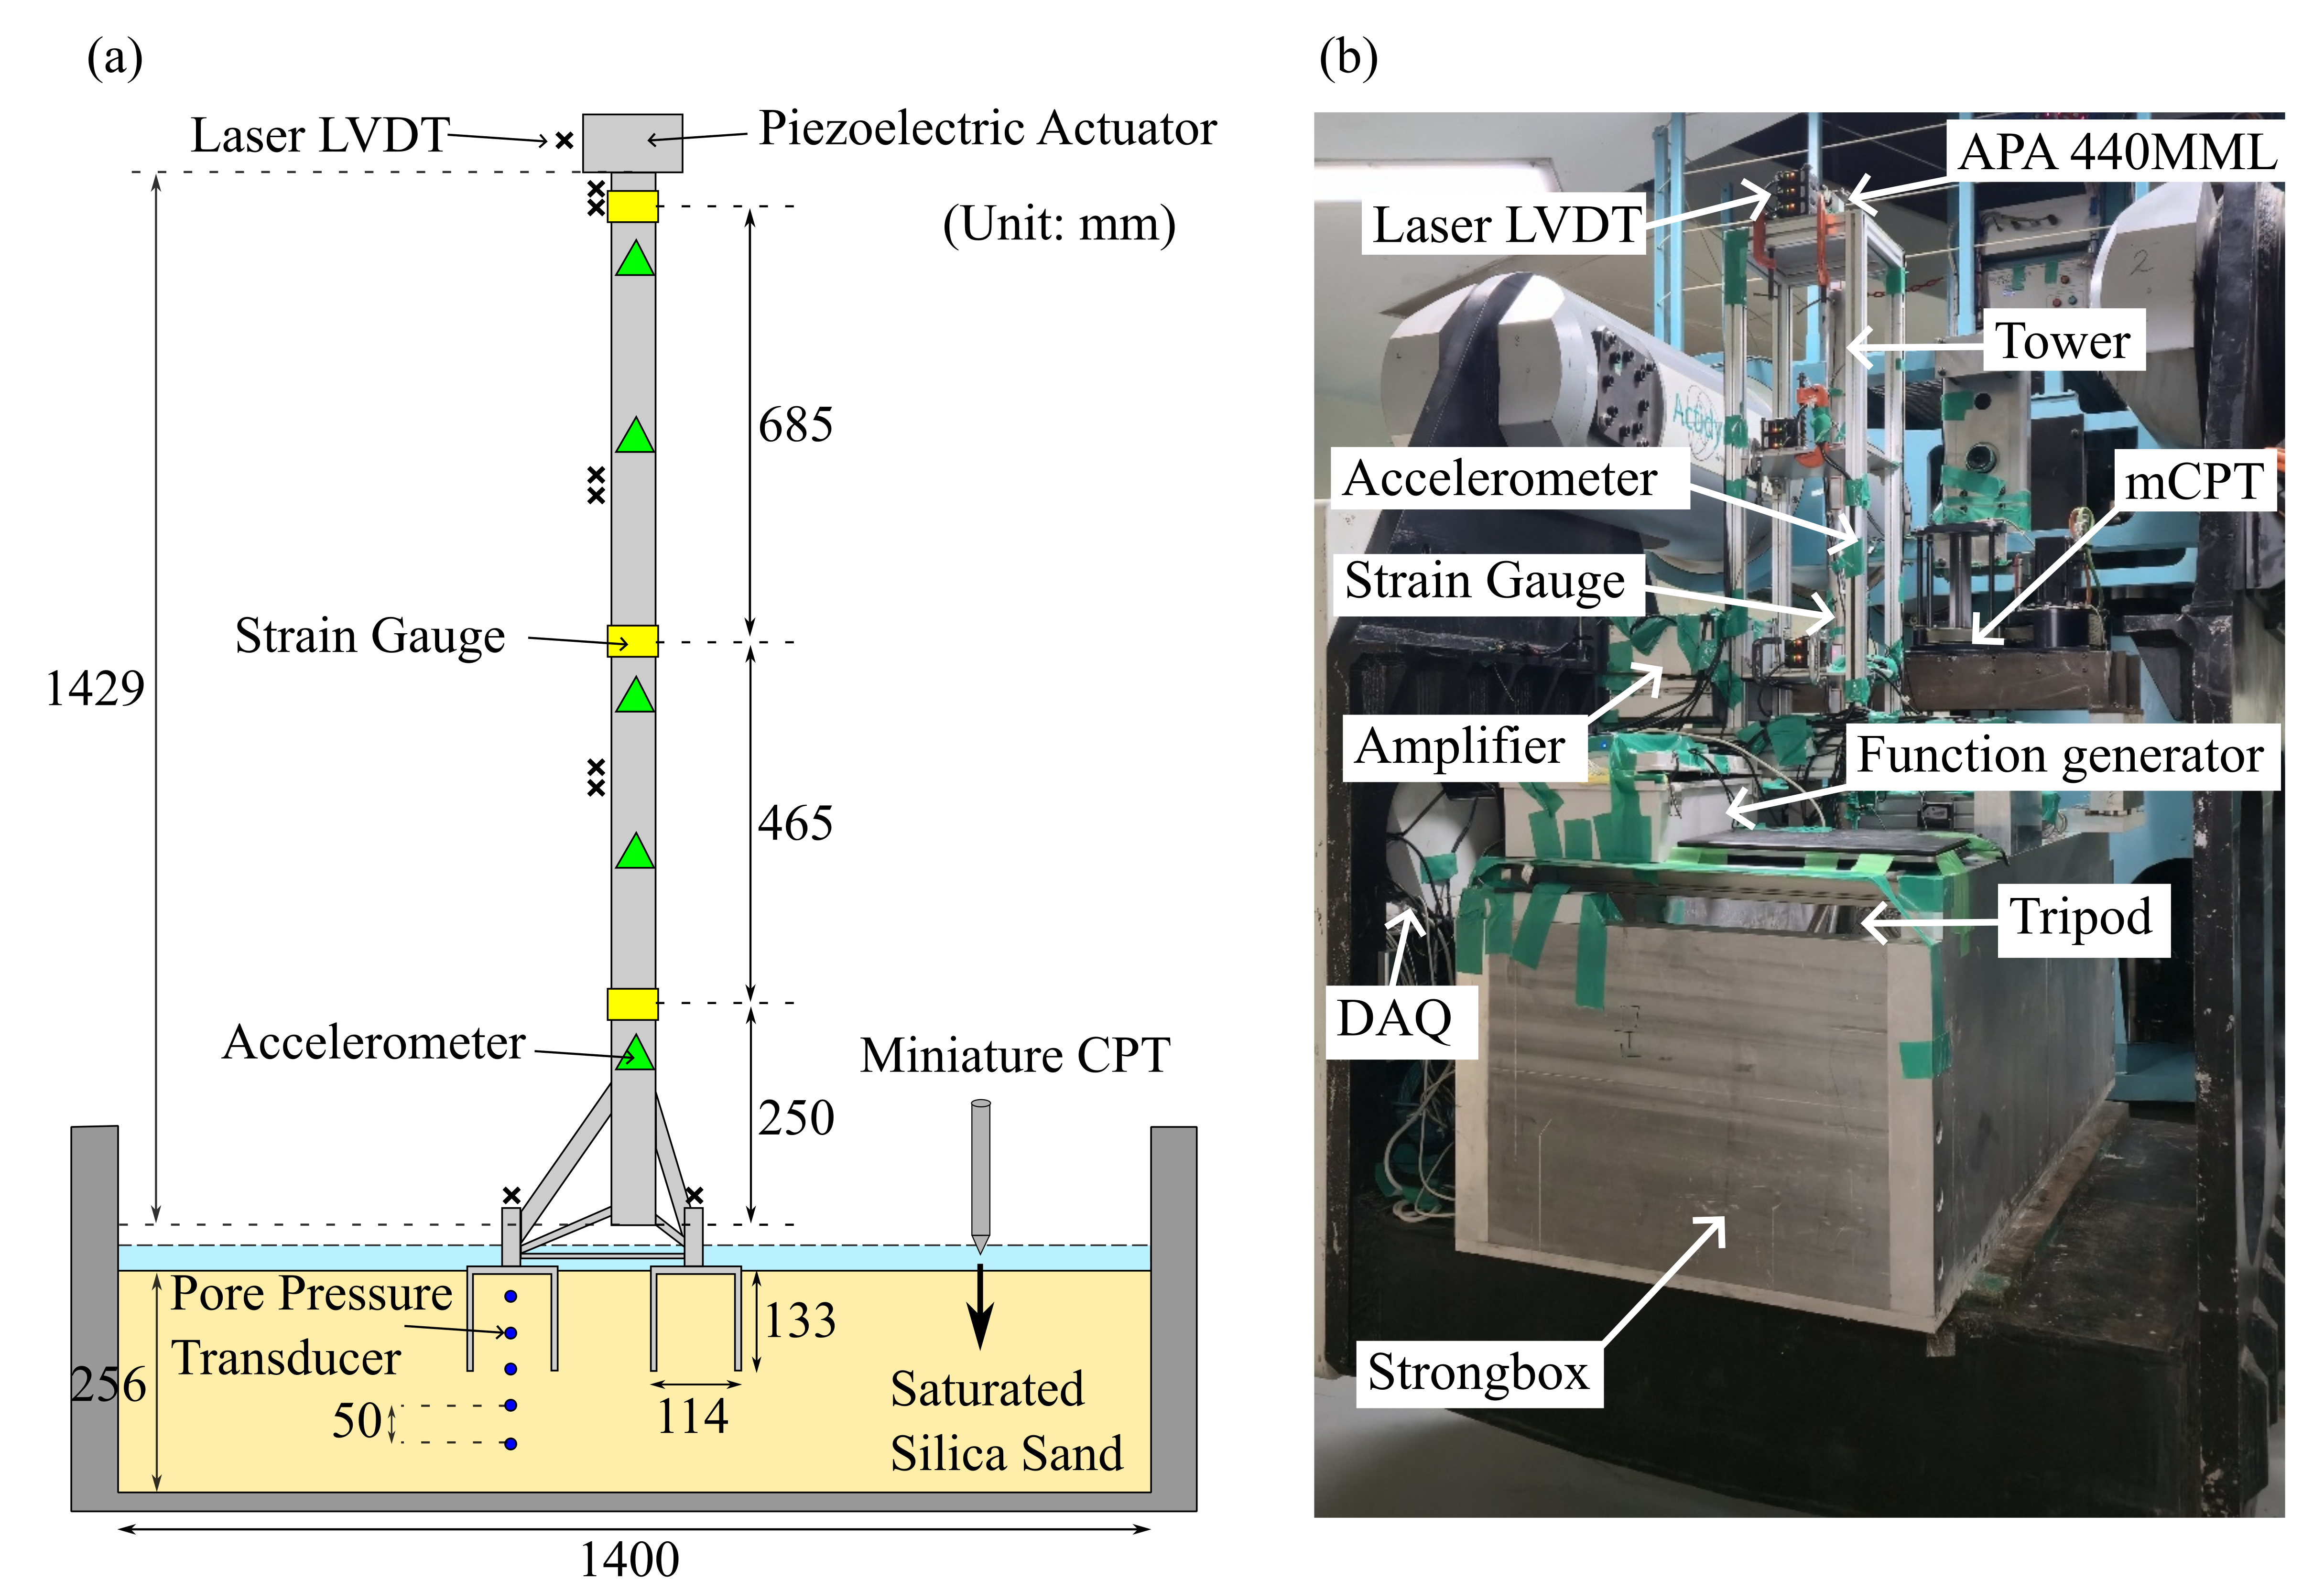
Figure 2: Centrifuge model configuration at 1:70 scale. (a)
Cross-sectional schematic; the section plane cuts through buckets A and
B, so bucket C is geometrically hidden behind B on the line of sight.
(b) Photograph of the model installed in the KAIST beam centrifuge. (c)
Plan view of the tripod bucket layout (generated from
generate_fig1_plan_view.py): the three buckets A, B, C occupy the
vertices of an equilateral triangle with side \(L_{\mathrm{base}} = 20.0\)
m (prototype scale), and the shake direction is aligned with the A-B
axis. The plan view confirms the 3-fold tripod symmetry; B and C are
mirror-symmetric about the A-B axis. All dimensions in mm (model scale)
unless noted otherwise.
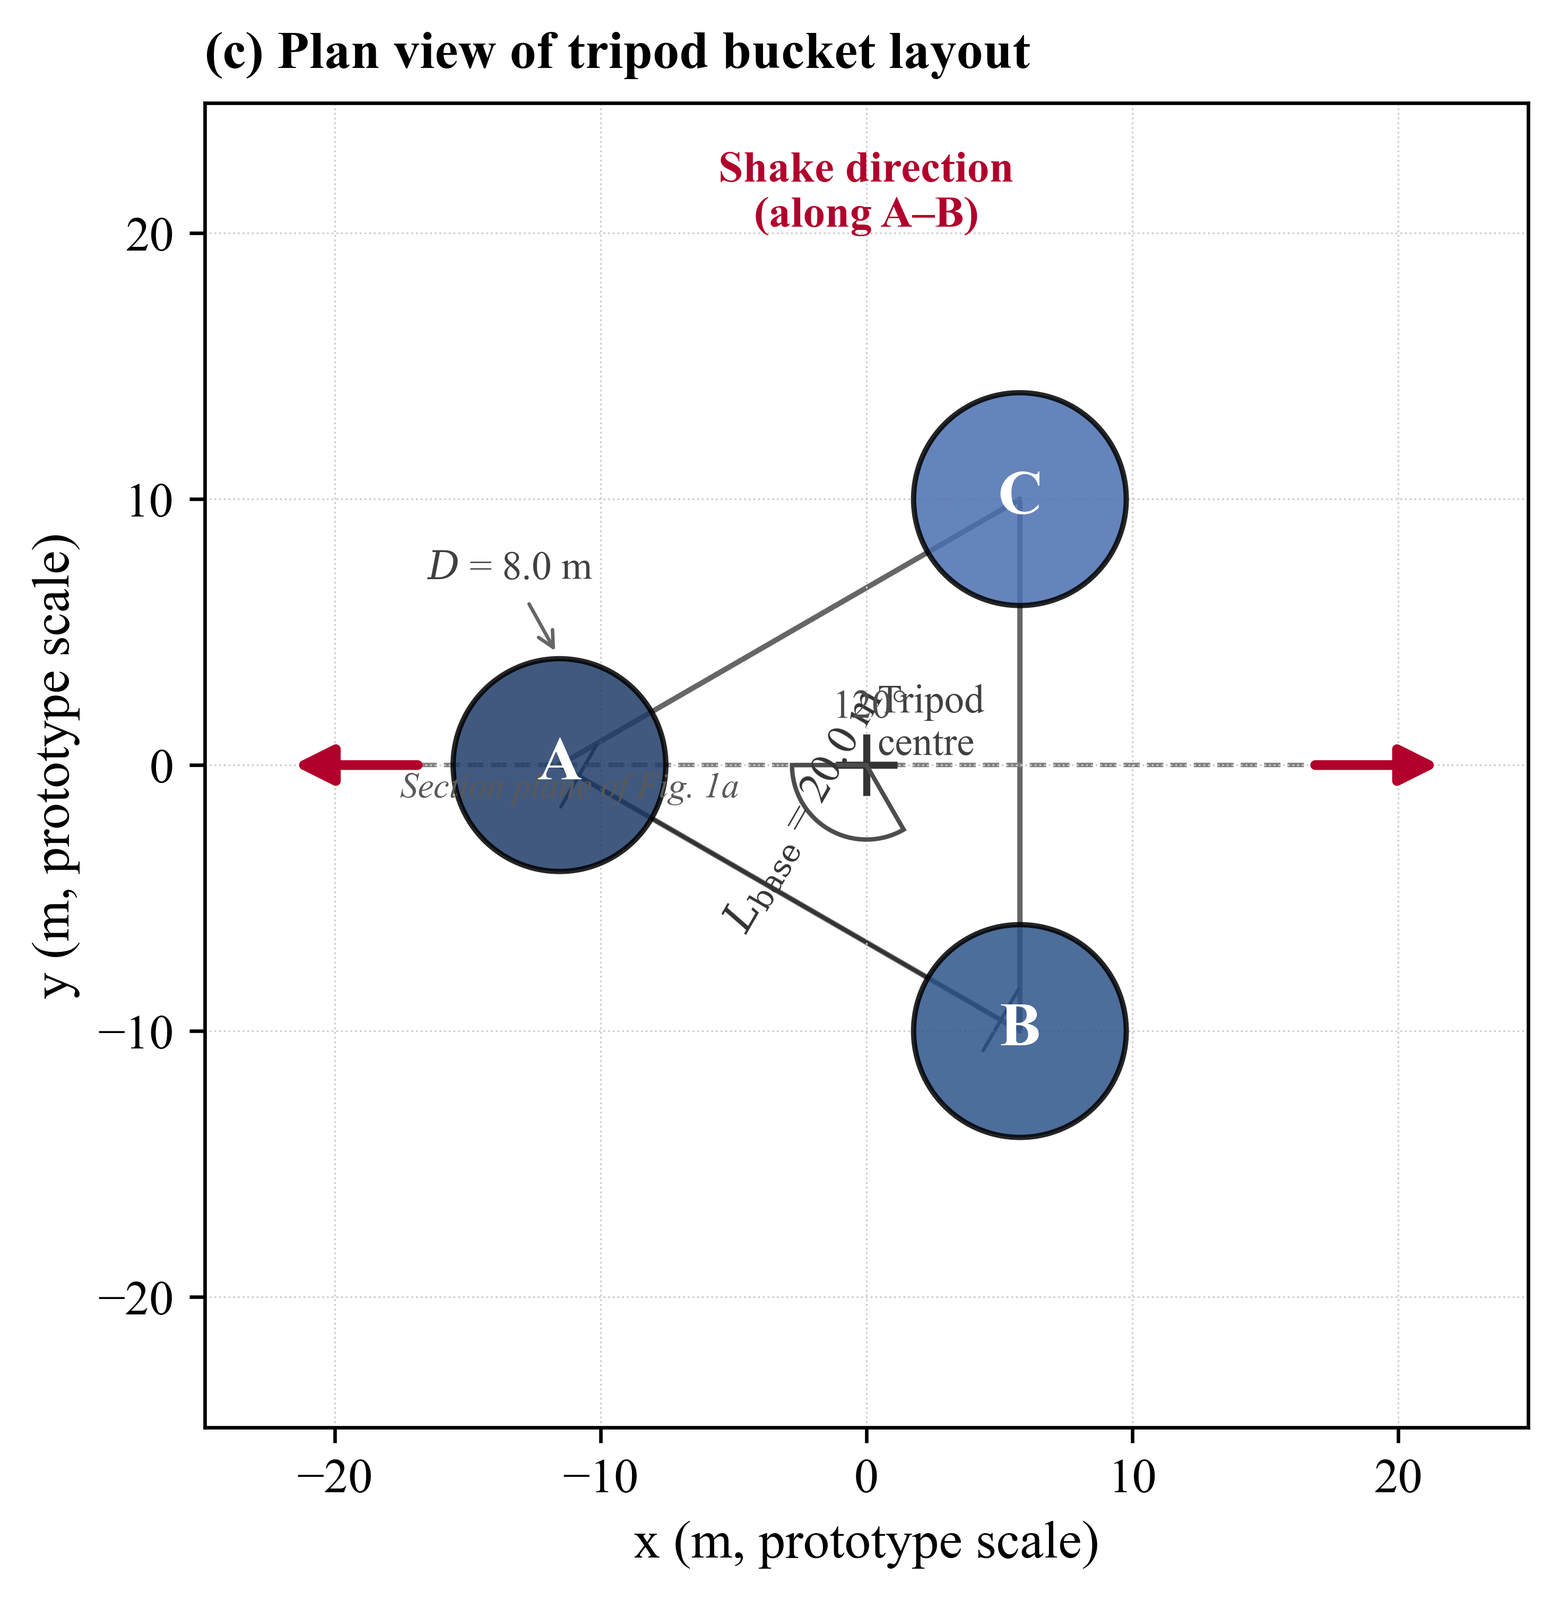
Figure 3: Plan view of the tripod bucket layout corresponding to panel (c) of Fig. 2, regenerated as a standalone sub-figure for clarity.
Fig. 2 presents a cross-sectional schematic of the centrifuge model, indicating the structural configuration, sensor locations, and scour geometry. Each flight followed a consistent protocol: spin-up to \(70g\) over approximately 15 minutes, pore pressure equilibration (monitored until PPT readings stabilised within \(\pm 0.002\) bar), in-flight CPT measurement (baseline flights only), and dynamic testing comprising impulse, sinusoidal, and square-wave excitation sequences. Each flight produced 22–26 minutes of continuous recording at sampling rate of 5,000 Hz, yielding 2.6–2.9 GB of raw data per test case. Between flights, the centrifuge was stopped, the next scour stage was excavated at \(1g\), and the model was re-spun. A complete test series (five flights) required approximately three working days including soil bed preparation and saturation.
The scour was simulated by progressively excavating soil around each suction bucket at \(1g\) using the custom concentric excavation tool and frustum-shaped scour geometry described in K.-S. Kim et al. (2025a). Four scour stages (\(S/D = 0\), 0.19, 0.39, 0.58) were applied symmetrically to all three buckets; the maximum depth corresponds to approximately 4.7 m at prototype scale. Under saturated conditions, actual scour depths could not be verified visually due to water turbidity; the reported \(S/D\) ratios are based on the excavation tool target settings and independently checked through cumulative excavated soil mass. The water level was maintained above the soil surface throughout to preserve saturation. For the backfill tests (T4-5, T5-5), the maximum-scour condition was remediated by infilling the scour holes with approximately 20 kg of pre-saturated No. 5 sand (\(d_{50} = 1.99\) mm), a coarser fill material simulating engineered scour protection. The backfill was poured at \(1g\) while maintaining the water level and lightly tamped (approximately 10 applications per bucket) to achieve a moderately dense state.
A total of 22 test cases represent one of the larger centrifuge programmes for OWT scour sensitivity. For comparison, Futai et al. (2018) tested four configurations (two densities \(\times\) two foundation types) at 50\(g\); Kariyawasam et al. (2020) applied 22 scour steps across four different bridge foundation models at 75\(g\); and Cabrera et al. (2012) tested two embedment conditions at 100\(g\). None of these programmes included both saturation and backfill stages.
Table 1: Centrifuge test programme (22 test cases).
| Test Series | Cases | Soil | \(D_r\) (%)\(^\dagger\) | Sat. | \(S/D\) | \(S\) (m) | Ref. |
|---|---|---|---|---|---|---|---|
| T1 | 4 | No. 7 sand | 82.7 | Dry | 0–0.49 | 0–3.9 | K.-S. Kim et al. (2025a) |
| T2 | 4 | No. 7 sand | 58.1 | Dry | 0–0.61 | 0–4.9 | K.-S. Kim et al. (2025a) |
| T3 | 4 | No. 8 sand–silt | 56.7 | Dry | 0–0.56 | 0–4.5 | K.-S. Kim et al. (2025a) |
| T4 | 4+1(BF) | No. 7 sand | 70.2 | Sat. | 0–0.58 | 0–4.7 | This study |
| T5 | 4+1(BF) | No. 7 sand | 60.8 | Sat. | 0–0.58 | 0–4.7 | This study |
\(^\dagger\) \(D_r\) from in-flight CPT using Baldi et al. (1986). BF = backfill with No. 5 sand.
Model Configuration and Instrumentation¶
The 1:70 scale model replicated the UNISON U136 4.2 MW offshore wind turbine supported by a tripod suction bucket foundation at the Gunsan demonstration site (water depth 13.6 m). Standard centrifuge scaling laws apply (Kutter, 1992; Madabhushi, 2014); Table 2 summarises the key scaling factors at \(N = 70\). Table 3 summarises the prototype and model structural parameters.
Table 2: Centrifuge scaling laws at \(N = 70\) (Kutter, 1992; Madabhushi, 2014).
| Parameter | Scale factor (model/prototype) | Dimensions |
|---|---|---|
| Length | \(1/N\) | L |
| Mass | \(1/N^3\) | M |
| Stress | 1 | ML\(^{-1}\)T\(^{-2}\) |
| Strain | 1 | – |
| Force | \(1/N^2\) | MLT\(^{-2}\) |
| Acceleration | \(N\) | LT\(^{-2}\) |
| Time (dynamic) | \(1/N\) | T |
| Frequency | \(N\) | T\(^{-1}\) |
| Displacement | \(1/N\) | L |
The prototype tower is tapered (bottom \(D = 4.2\) m, top \(D = 3.5\) m, wall thickness 17–45 mm). Because the model uses ASTM-A240M(STS 304) stainless steel (\(E = 193\) GPa) (POSCO Mobility Solution, 2024) instead of the prototype S420ML (\(E = 210\) GPa), geometric scaling alone does not preserve the flexural rigidity \(EI\) that governs the first natural frequency. An equivalent-section design was therefore adopted (Bhattacharya, 2019). The tapered tower was first reduced to an equivalent uniform cylinder following Jalbi et al. (2019), yielding \(EI_\text{eq} = 172\) MN\(\cdot\)m\(^2\). A commercially available ASTM-A240M(STS 304) hollow tube (\(d = 56.4\) mm) closest to the scaled equivalent diameter was selected, and the wall thickness was adjusted to satisfy \((EI)_\text{model} = (EI)_\text{proto}/N^4\). For a thin-walled tube, the required model wall thickness is:
Five such cylinders (\(d = 56.4\) mm, \(t = 0.5\) mm) were laser-welded and mounted on the tripod substructure, giving a total model height of 1,478 mm. The resulting \(EI_\text{eq} = 168\) MN\(\cdot\)m\(^2\) at prototype scale matches the target to within \(-2.3\)%. The structural stiffness was verified under a fixed-base condition by bolting the foundation to a thick steel plate and measuring the natural frequency, confirming that the model \(EI\) matched the design value. The RNA was modelled as a lumped point mass at the tower top (Section 2.3). The identical structural model was used for both the dry-sand tests (K.-S. Kim et al., 2025a) and the present saturated tests, so differences between dry and saturated results are not caused by the structure.
Table 3: Prototype and model structural parameters.
| Property | Symbol | Prototype | Model (1:70) |
|---|---|---|---|
| Material | – | S420ML (\(E=210\) GPa) | ASTM-A240M (\(E=193\) GPa) |
| Tower diameter | \(d_T\) | 3.5–4.2 m | 56.4 mm |
| Tower wall thickness | \(t_T\) | 17–45 mm | 0.5 mm |
| Tower height | \(h\) | 72.7 m | 1,429 mm\(^\S\) |
| Bucket diameter | \(D\) | 8.0 m | 114.3 mm |
| Skirt length | \(L\) | 9.3 m | 132.9 mm |
| Skirt wall thickness | \(t_s\) | 20 mm | 0.3 mm |
| Bucket spacing | \(L_\text{base}\) | 20.0 m | 285.7 mm |
| Flexural rigidity \(^\dagger\) | \(EI_\text{eq}\) | 172 MN\(\cdot\)m\(^2\) | 168 MN\(\cdot\)m\(^2\) |
| RNA mass | \(m_\text{RNA}\) | 338 t | 1.08 kg\(^\ddagger\) |
| Total mass | \(m_\text{tot}\) | 1,213 t | 3.62 kg |
\(^\dagger\) Prototype \(EI_\text{eq}\) by Jalbi et al. (2019); \(^\ddagger\) Inclusive of the prototype-equivalent of the APA actuator mounting hardware (bolts and plates); see Section 2.2.1. \(^\S\) Total model height is 1,478 mm including tripod transition.
Prototype-to-model conversion error budget¶
Prototype-to-model conversion follows the scaling laws in Table 2 applied consistently to every geometric and material parameter. Two deliberate deviations from perfect similitude are disclosed here because they set the achievable accuracy of the reported first-mode frequencies.
RNA over-representation (+9.6 % of the as-built tower-top mass). The APA440MML actuator plus its mount hardware weighs 1.08 kg irreducibly, which scales to 370.4 t at prototype under \(N^3\) mass scaling. The inclusive RNA target of 338 t listed in Table 3 already accounts for the prototype-equivalent of the actuator mounting hardware (bolts, clamping plates, actuator housing) that has no direct turbine counterpart but occupies the tower-top node. The residual 32.4 t (9.6 % of the 338 t inclusive target) is a fine-detail over-representation of the as-built mounting hardware that cannot be further reduced without compromising the actuator force authority. Using the Rayleigh cantilever approximation \(f_1 \propto 1 / \sqrt{m + 0.23 m_t}\) with tip mass \(m\) and distributed tower mass \(m_t\), the 9.6 % over-representation produces an absolute \(f_1\) under-prediction bounded at approximately 3–4 %. Because this bias is constant across all five test series (T1–T5 share the same tower-top hardware), it cancels exactly when the relative frequency change \(\Delta f_1 / f_{1,0}\) is computed, which is the quantity reported in Table 6 and used for all scour-sensitivity conclusions. The companion J2 numerical-modelling paper on the same turbine applies the narrower rotor-nacelle-only mass (280.5 t per the as-built Weight Control Report) at the tower-top OpenSees node and distributes the auxiliary platform, boat-landing, and anode masses across lower tripod nodes; the 57.5 t gap between that narrow value and the 338 t centrifuge target is the prototype-equivalent of the APA mounting hardware that the centrifuge model necessarily carries at the tower top.
Flexural-rigidity under-match (\(-2.3\) % of the prototype target). The assembled five-cylinder model tower achieves \(EI_\text{eq} = 168\) MN\(\cdot\)m\(^2\) against the prototype target of 172 MN\(\cdot\)m\(^2\). Two contributors: the ASTM-A240M model material has \(E = 193\) GPa versus the S420ML prototype \(E = 210\) GPa (\(-8.1\) %), partially compensated by model-tower wall thickness at the upper end of the fabrication tolerance band via Eq. 1. Because \(f_1 \propto \sqrt{EI}\), the \(-2.3\) % \(EI_\text{eq}\) under-match maps to a \(-1.15\) % \(f_1\) under-prediction, below the 2.5 % inter-channel measurement scatter reported in Section 2.3 and therefore not a limiting factor on the reported scour trends.
Other conversions match exactly or within instrument tolerance. Bucket diameter, skirt length, skirt wall thickness, and bucket spacing scale exactly at 1:70 because the bucket assembly was custom-fabricated for this programme. The tower height of 1,429 mm includes the 336 mm scaled tripod transition; the plain tapered-tower portion is 1,093 mm, matching the 72.7 m prototype tower at 1:70 within 0.6 %. Total mass scaling (\(1{,}213\) t \(\rightarrow\) 3.62 kg) is within 2.4 % of exact similitude, dominated by the tip-mass over-representation discussed above. The prototype-to-model mapping of the in-situ soil stress profile is handled by the \(N = 70\) centrifugal acceleration, as verified in flight by the CPT \(q_c\) measurements in Section 2.5.
The Year 2 instrumentation comprised 53 channels on the KAIST data acquisition system (DAQ PXI-1045 system with a catman Easy/AP software): 21 accelerometer channels (20 ADXL1003 MEMS devices at five tower elevations with biaxial coverage plus one tower-top piezoelectric sensor) for modal identification and mode shape reconstruction; 12 strain gauge channels at three elevations for bending moment profiles; 10 Keyence laser displacement channels (seven along the tower and three at bucket caps A, B, C) for settlement and dynamic displacement; five pore pressure transducers (PPTs) inside bucket A at 50 mm spacing for saturation verification; and one in-flight miniature CPT channel for soil characterisation. The miniature CPT system and its calibration procedure are described in Kim et al. (2017); for boundary and particle size effects on miniature cone tip resistance in centrifuge sand models, readers are referred to Kim et al. (2016). The MEMS accelerometers were individually calibrated on a 1\(g\) shaking table by applying known sinusoidal accelerations across the operational frequency range and fitting the sensor output to the reference shaker signal. The principal additions over the Year 1 configuration (32 channels) were the PPTs, the expanded accelerometer array, and the miniature cone penetrometer. Some of the systematic sensor faults (e.g., accelerometer in lower mid side; PPT 1 non-functional due to chassis problem in DAQ) were excluded from analyses.
Dynamic Excitation System¶
Cabrera (2011) developed an amplified piezoelectric actuator (APA) system for measuring natural frequencies in a geotechnical centrifuge. The actuator generates horizontal inertial forces through a blocked-free configuration with a sliding mass on linear bearings (Cabrera et al., 2012; Claeyssen et al., 2007). Futai et al. (2018) and Futai et al. (2021) applied the system to monopile and gravity base foundation models at 50\(g\), and Kariyawasam et al. (2020) compared it with automatic modal hammer excitation at 75\(g\).
In this study, a Cedrat Technologies APA440MML actuator was implemented on the KAIST beam centrifuge, the first application of this system in a Korean centrifuge facility. The actuator was mounted horizontally at the tower top and served two purposes simultaneously: it provided the excitation input and it represented the rotor-nacelle assembly (RNA) as a point mass at the hub-height node. The total tower-top assembly mass is 1.08 kg in the model, scaling to approximately 370 t at prototype under the \(N^{3}\) mass-scaling law. The prototype-equivalent “RNA” target listed in Table 3 is 338 t; by design this figure is inclusive, covering both the 4.2 MW Gunsan rotor-nacelle assembly and the prototype-equivalent of the APA mounting hardware (bolts, clamping plates, and actuator housing) that occupies the tower-top node in the model and has no direct turbine counterpart. The residual difference between the 370.4 t physical hardware scaling and the 338 t inclusive target (32.4 t, a 9.6% over-representation of the as-built tower-top mass) is an irreducible consequence of the APA mounting mass and is bounded in Section 2.2.1. The APA440MML system supports three excitation modes — impulse release, sinusoidal frequency sweep, and square-wave pulse — that together cover the standard repertoire of transient, stationary, and step excitation used in structural dynamic identification. In the programme reported here, impulse-release free-decay is the primary method: all first-mode natural frequencies \(f_1\) tabulated for series T1–T5 are extracted from the exponentially-decaying ringdown that follows each impulse release. Sinusoidal sweep excitation (1–5 Hz model scale) was used before each test series as a frequency-range health-check on the actuator-structure chain and to verify that the dominant response peak lay well inside the expected 10–15 Hz band at model scale. Square-wave pulse excitation was used at each scour stage to verify amplitude linearity: because the square-wave step energises all harmonics below its rise-time limit, a linear response returns the same \(f_1\) regardless of pulse amplitude. These two modes supported the primary method rather than providing independent quantitative \(f_1\) estimates for this paper.
A dedicated companion study by the same research team (K.-S. Kim et al., 2025b) addressed the cross-method comparison directly. Using stochastic-subspace identification (SSI-COV) on 5.0 s sliding windows over 800 s of continuous monitoring, the natural frequency was clustered in the range 10.5–11 Hz for both Forced and Free Vibration conditions, with only minor differences between the two. The inter-method difference is therefore small relative to the within-test window-to-window scatter of approximately \(\pm 0.25\) Hz. In the present programme, the full scour-induced \(f_1\) shift across stages is 0.085 Hz for T4 and 0.26 Hz for T5 (Table 6), both larger than the ISFOG inter-method scatter band, so the choice of excitation mode does not confound the scour-induced trends that are the subject of the present work.
Amplitude nonlinearity in the soil-structure system is a standard concern for modal identification in centrifuge tests because soil shear modulus is strain-amplitude-dependent. The impulse amplitudes used here placed the foundation response at shear strains well below the \(10^{-4}\) threshold for strain-amplitude-dependent stiffness loss, so the small-strain shear modulus \(G\) remains within a few percent of the reference \(G_{\max}\) (Hardin and Drnevich, 1972). The reported \(f_1\) values therefore represent the small-strain dynamic stiffness of the foundation at each scour stage, not an amplitude-dependent chord-stiffness that would vary with excitation energy.
Prior to centrifuge testing, the MEMS accelerometers and dynamic load cell (DDE-250 N) were calibrated at KAIST and on a 1\(g\) shaking table at Seoul National University. The excitation amplitudes were based on BLADED integrated load analysis results per IEC 61400-3. Acceleration response was recorded by 20 MEMS accelerometers (ADXL1003) at five tower elevations, with a tower-top piezoelectric accelerometer as a high-frequency reference. The load cell adjacent to the actuator recorded the input force for FRF computation (Futai et al., 2018).
The first natural frequency \(f_1\) was identified from the free-decay response following each impulse excitation. Raw signals were mean-removed, screened for faulty channels, and segmented into 10.0 s ringdown windows beginning 0.5 s after cessation of excitation. The PSD of each segment was computed using Welch’s method (Welch, 1967) with a 1.0 s Hann window (\(\Delta f = 1.0\) Hz) and 50% overlap. For each channel, \(f_1\) was identified as the dominant PSD peak within the 5–20 Hz search range (model scale), refined by three-point parabolic interpolation.
The composite frequency for each test case was taken as the median across all operational channels. The inter-channel standard deviation was 0.005–0.012 Hz, and the minimum stage-to-stage decrement (0.026 Hz for T4) exceeded this scatter by a factor of two to five. The effective precision is bounded by the signal-to-noise ratio rather than the interpolation algorithm alone. All frequencies are reported in model scale; prototype-scale values follow \(f_\text{proto} = f_\text{model}/N\).
Higher-mode behaviour was examined but is reported only as a context
measurement. Power-spectral-density analysis of the ringdown signals
identified a clear second-mode peak near 110 Hz at model scale
(\(\approx 1.57\) Hz at prototype scale) in every test case, with a
mode-1-to-mode-2 ratio of approximately 10 that is consistent with a
near-uniform cantilever tower supported on a soil foundation. The
second-mode peak position was found to vary less than \(f_1\) across the
scour stages tested: fractional variation of \(f_2\) from baseline to
\(S/D = 0.58\) remained within the width of its PSD peak in both T4 and
T5, whereas \(f_1\) showed the progressive decrement reported in
Table 6. The
reduced foundation sensitivity of \(f_2\) is expected because the
second-mode curvature distribution concentrates its strain energy in the
upper half of the tower rather than at the foundation, so the second
mode is a poorer scour-diagnostic than \(f_1\) on this geometry. The
reported monitoring conclusions therefore use \(f_1\) exclusively; the
second-mode PSD peak is tracked across all tests only as a cross-check
that the excitation chain is producing clean broadband response rather
than a narrow-band artefact, and the full PSD records are archived in
analysis1/results/psd_plots/ for independent inspection.
Soil Properties and Saturation¶
T4 and T5 used SNU silica sand No. 7 (\(G_s = 2.65\), \(d_{50} = 0.21\) mm, \(e_\text{min} = 0.514\), \(e_\text{max} = 1.054\)) prepared at dense and loose relative densities under water-saturated conditions. The SNU silica sand was selected based on particle size distribution comparison with field samples obtained from the KOWP Gunsan demonstration site (Korea Offshore Wind Power, 2021). Prior to centrifuge testing, a series of direct shear tests were conducted using No. 7 Silica Sand which yielded internal friction angle of 43.1 deg (peak) and 37.7 (residual). The choice of No.8 was based upon the suspected cohesion effect. The silt particles are finer and can induce slight cohesion, making it harder for the soil particles to slide into different arrangement (soil fabric) during vibration. However, this effect turned out to be minimal and negligible. Target densities were matched to T1 (dense) and T2 (loose) to enable direct dry-to-saturated comparison; actual relative densities were determined from in-flight CPT (Section 3.1). Table 4 below summarises the index properties.
Table 4: Index properties of SNU silica sand No. 5, No. 7, and No. 8 used in this study.
| Property | Symbol | No. 5 | No. 7 | No. 8 |
|---|---|---|---|---|
| USCS class | – | SP | SP | SP-SM |
| Specific gravity | \(G_s\) | 2.65 | 2.65 | 2.65 |
| Max. density [t/m³] | \(\gamma_{d,\max}\) | 1.69 | 1.75 | 1.66 |
| Min. density [t/m³] | \(\gamma_{d,\min}\) | 1.30 | 1.29 | 1.23 |
| Min. void ratio | \(e_{\min}\) | 0.568 | 0.514 | 0.596 |
| Max. void ratio | \(e_{\max}\) | 1.038 | 1.054 | 1.154 |
| Median grain size [mm] | \(d_{50}\) | 1.99 | 0.21 | 0.15 |
| Eff. grain size [mm] | \(d_{10}\) | 0.76 | 0.09 | 0.07 |
| Fine Content [%] | FC | 0.0 | 5.8 | 12.4 |
| Uniformity coeff. | \(C_u\) | 3.33 | 2.45 | 2.27 |
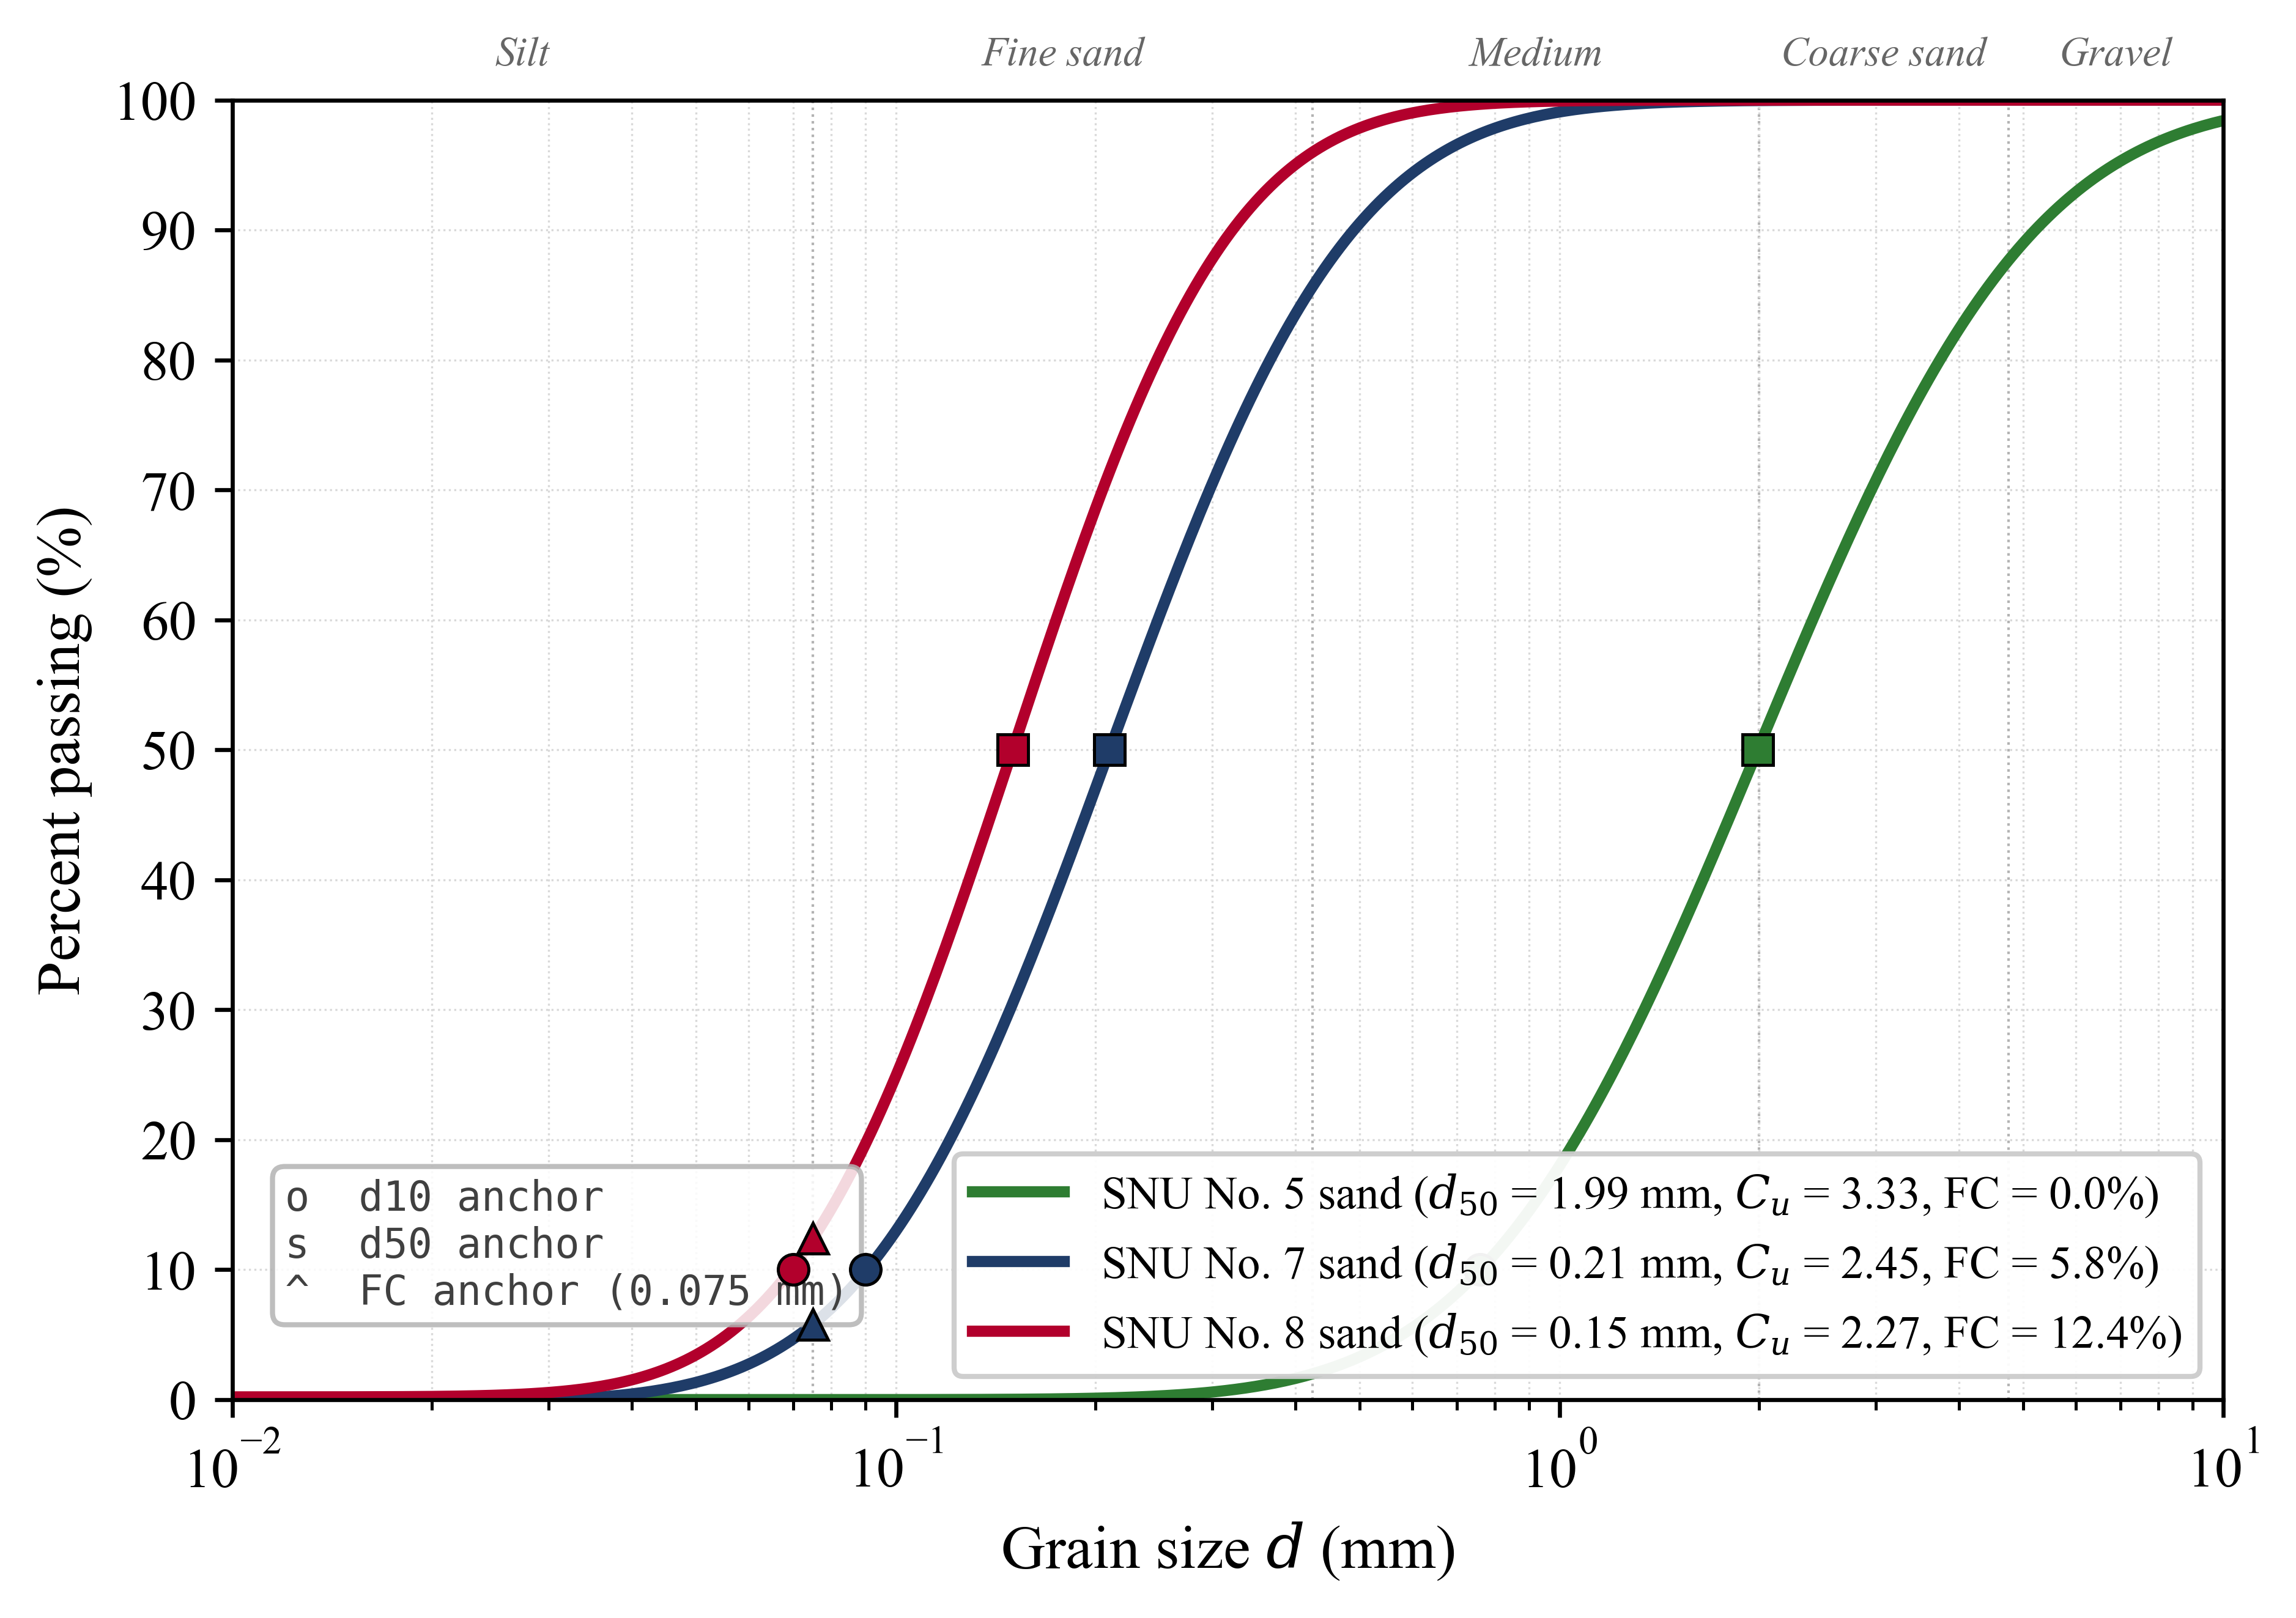
Figure 4: Particle-size distribution curves for the three SNU silica sands used in this programme, constructed from the \(d_{10}\), \(d_{50}\), and fines-content anchor points in Table 4. All three sands classify as poorly-graded sand (SP or SP-SM per USCS). No. 7 is the test-bed sand for series T1 through T5, No. 8 is the silt-fraction sand used in T3, and No. 5 is the coarse backfill sand used at the remediation stage of T4-5 and T5-5. The USCS textural subdivisions are shown as vertical dotted lines at 0.075, 0.425, 2.0, and 4.75 mm.
The model ground was prepared using the KAIST automatic air-pluviation apparatus following SPS-F KOCED guidelines. For the saturated series, the sand deposit was saturated by top-down water infiltration after pluviation and model installation. Water was applied at a controlled flow rate of approximately 1–2 drops per second with a geotextile layer on the surface to prevent localised erosion. Infiltration continued for approximately 3–4 days until the wetting front reached the surface across the entire plan area and free water was raised to approximately 10 mm above the soil surface. Previous centrifuge studies on tripod suction bucket foundations (Jeong et al., 2021b, 2021a; Jeong et al., 2019; D.-J. Kim et al., 2014; Seong et al., 2017) used the same top-down water infiltration approach.
Water was used as the pore fluid rather than a viscous substitute (e.g., methylcellulose or silicone oil). In centrifuge modelling, dynamic events scale as \(1/N\) while diffusion events scale as \(1/N^2\) (Madabhushi, 2014). This time-scaling conflict requires a viscous pore fluid of kinematic viscosity \(N\) times that of water whenever excess pore pressure generation and dissipation govern the model response. In the present programme this conflict does not arise, for reasons that we now state explicitly following a reviewer prompt:
- Dominant measurement is stiffness, not pore-pressure response. The primary quantity reported here is the first natural frequency, which depends on the small-strain skeleton shear modulus \(G_0\). \(G_0\) is a property of the sand skeleton under its current effective stress state and is independent of the pore fluid viscosity at the excitation frequencies used (Hardin and Drnevich, 1972). The secondary structural-response quantities (displacement RMS, bottom bending strain, bucket cap settlement) are similarly controlled by skeleton stiffness rather than by pore-pressure diffusion.
- Strain amplitudes are below the threshold for pore-pressure generation. The impulse-release excitation places shear strains well below the \(10^{-4}\)-\(10^{-3}\) threshold conventionally associated with contractive dilatancy and cyclic pore-pressure build-up in clean sands (see Section 2.3). The dynamic PPT records acquired in parallel to the acceleration time-series show RMS amplitudes of \(10^{-5}\)-\(10^{-4}\) bar during vibration events, two orders of magnitude below any level indicative of measurable excess pore pressure.
- Characteristic diffusion time at model scale is short compared with the inter-ringdown interval. For the No. 7 sand used here (\(d_{50} = 0.21\) mm), the 1D consolidation time for a 150 mm model-scale drainage path is of the order of seconds at \(70g\) (\(t_c = H^2 / c_v\) with \(c_v \sim 10^{-2}\) m\(^2\)/s for clean saturated medium sand), so any pore pressure perturbation induced by a single 10 s ringdown window would dissipate completely before the next excitation, preventing cumulative build-up across the test programme.
- Ignoring water permeability scaling does not bias the reported sensitivity. Because the three arguments above remove the diffusion pathway as an active variable, the \(N\)-\(N^2\) time-scaling conflict leaves the reported \(f_1\) and structural-response trends unaffected at the excitation amplitudes used here. The conclusion that saturated sand is approximately 25% less scour-sensitive than dry sand at matched density (§4.3) would be modified only if partially-drained cyclic softening or rate-dependent viscous stiffness were active in the range of strain amplitudes tested, which the PPT records rule out.
We acknowledge two consequences that this choice does impose. First, the conclusions do not extend to partially-drained phenomena at larger strain amplitudes: storm-scale or seismic cyclic loading that drives the foundation into the \(10^{-3}\) strain regime would generate excess pore pressure whose dissipation rate is mis-scaled under water pore fluid. A repeat programme with a viscous pore fluid would be required for that regime. Second, the static consolidation stage during spin-up is effectively instantaneous at this permeability (see the 1g-to-70g reconsolidation discussion in Section 5.3), so any time-dependent consolidation settlement that the prototype would experience under real scour evolution is absent here. This second consequence is the main bridge between the reviewer’s permeability-scaling and reconsolidation concerns.
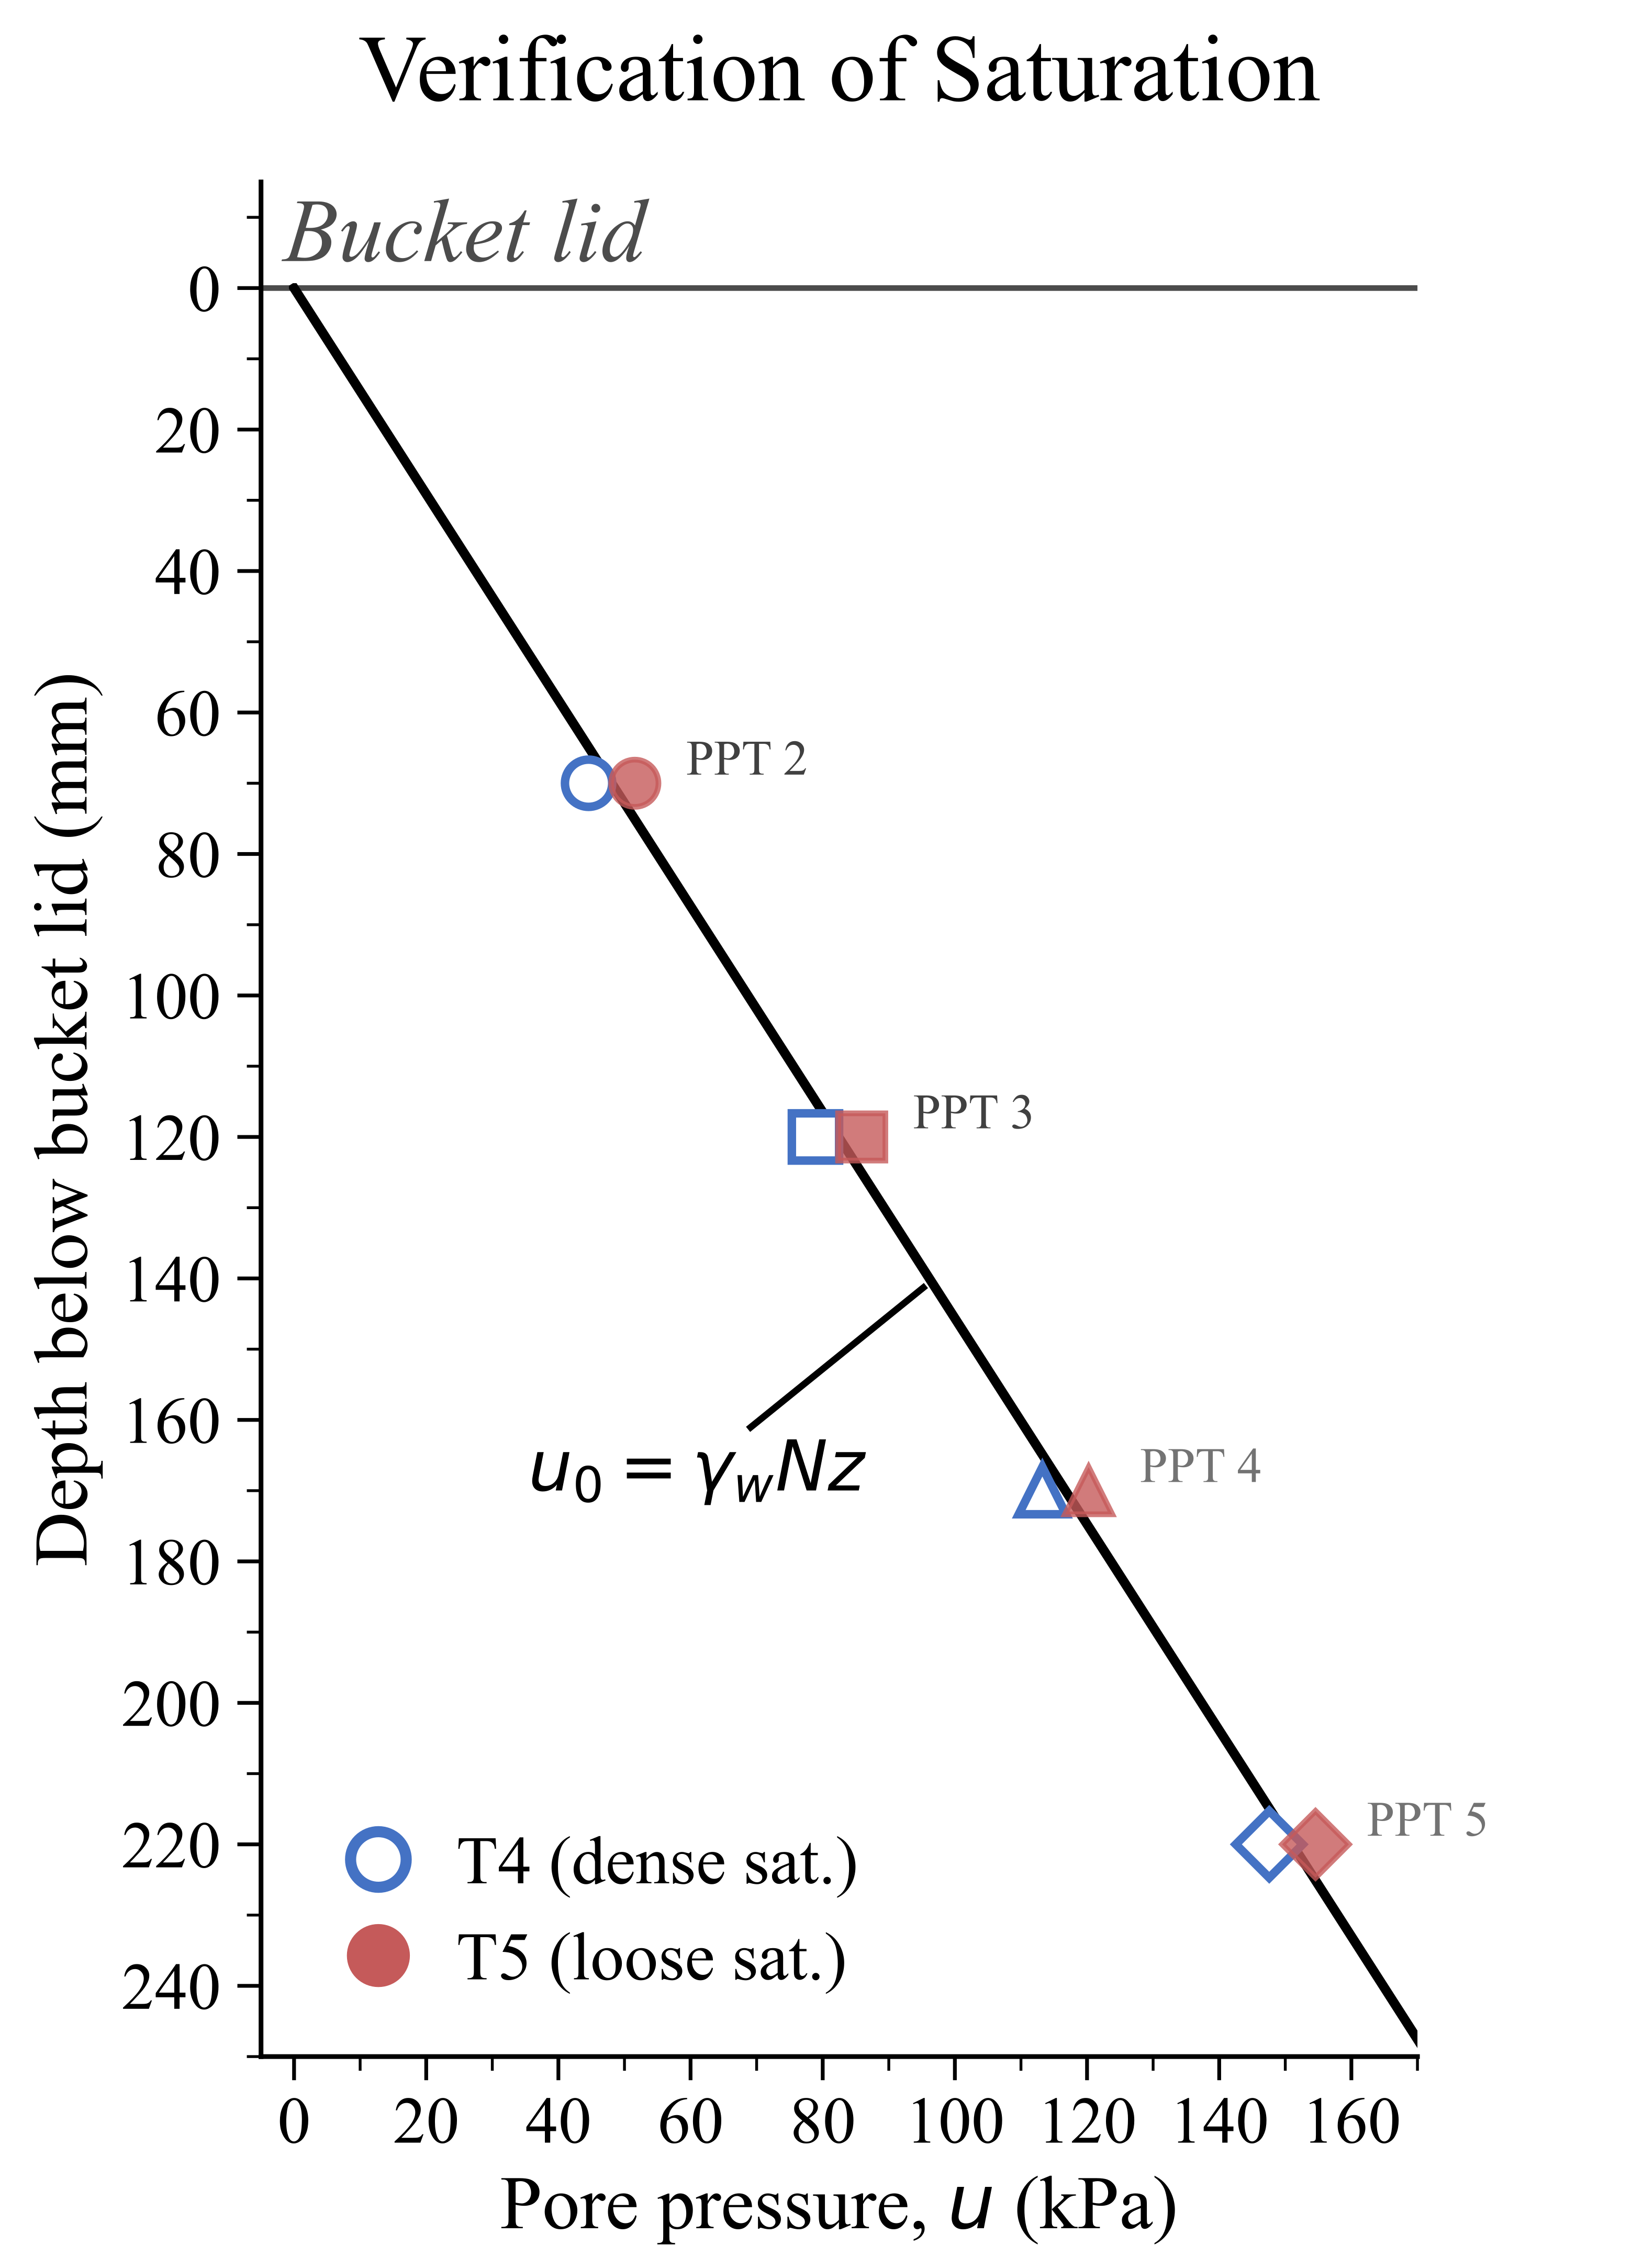
Figure 5: Hydrostatic pore pressure profile for the verification of model ground saturation.
Also, the degree of saturation (\(S_r\)) was not directly measured. Saturation quality was assessed indirectly through five PPTs installed inside bucket A at approximately 20 mm spacing. At \(70g\), fully saturated conditions produce a linear hydrostatic profile \(u_0 = \gamma_w \cdot N \cdot z\) (Fig. 5). The measured departures remained within \(\pm 0.003\) bar across all scour stages for both T4 and T5, confirming a continuous water column throughout the test programme. The dynamic PPT response during vibration events showed RMS amplitudes of \(10^{-5}\)–\(10^{-4}\) bar, two orders of magnitude below any threshold indicative of excess pore pressure generation. Any residual air would reduce the bulk stiffness and increase the apparent scour sensitivity, making the directional conclusion (dry \(>\) saturated) conservative.
In-Flight CPT Methodology¶
In-situ soil characterisation was performed through in-flight miniature cone penetration testing (CPT) at \(70g\), following the SPS-F KOCED centrifuge testing standard (KOCED, 2020). One measurement was conducted per test series at the baseline condition (\(S/D = 0\)) and one additional measurement after backfill placement for T4 and T5. A 10 mm diameter cone penetrometer was advanced at a constant rate of 1.2 mm/s (model scale) with the axial force acquired at 10 Hz. The CPT was positioned ~200 mm (20 \(d_c\)) from the nearest bucket foundation and ≥150 mm from the strongbox boundary, meeting the 20 \(d_c\) clearance requirement (Bolton et al., 1999; KOCED, 2020).
Soil properties were derived from the \(q_c\) depth profiles over a representative averaging window of 30–80 mm model depth (2.1–5.6 m prototype), corresponding to the embedment zone surrounding the suction bucket skirts that provide the most foundation resistance from soil. For backfill measurements (T4-5 and T5-5), penetration profiles were truncated to \(\leq 50\) mm model depth to isolate the No. 5 sand layer.
Relative density was estimated using the Baldi et al. (1986) correlation:
where \(C_0 = 61\), \(C_1 = 0.55\), and \(C_2 = 2.41\). An iterative procedure was employed to resolve the coupling between \(D_r\), void ratio, unit weight, and \(\sigma'_v\); convergence to within \(0.1\%\) was typically achieved within five to eight iterations.
The peak effective friction angle \(\phi'\) was estimated from Robertson and Campanella (1983):
The small-strain shear modulus \(G_0\) was inferred using the empirical \(V_s\)–\(q_c\) correlation of Kim et al. (2017), calibrated on Korean silica sands under centrifuge stress conditions:
where \(V_s\) is in m/s and \(q_c\) in MPa, with \(G_0 = \rho \, V_s^2\). All correlations were applied consistently to both Year 1 and Year 2 data to ensure that cross-series comparisons are free of processing bias.
Results¶
In-Flight CPT Soil Characterisation¶
The soil state at \(70g\) — not the target density at \(1g\) — governs the dynamic response. In-flight CPT confirmed the target soil conditions across all five test series (Table 5, Fig. 6). Seven measurements — one baseline per series plus two backfill measurements — were processed using consistent correlations (Section 2.5) to enable direct cross-series comparison. Applying the same correlations to all five series ensures that cross-series differences reflect soil state, not processing method.
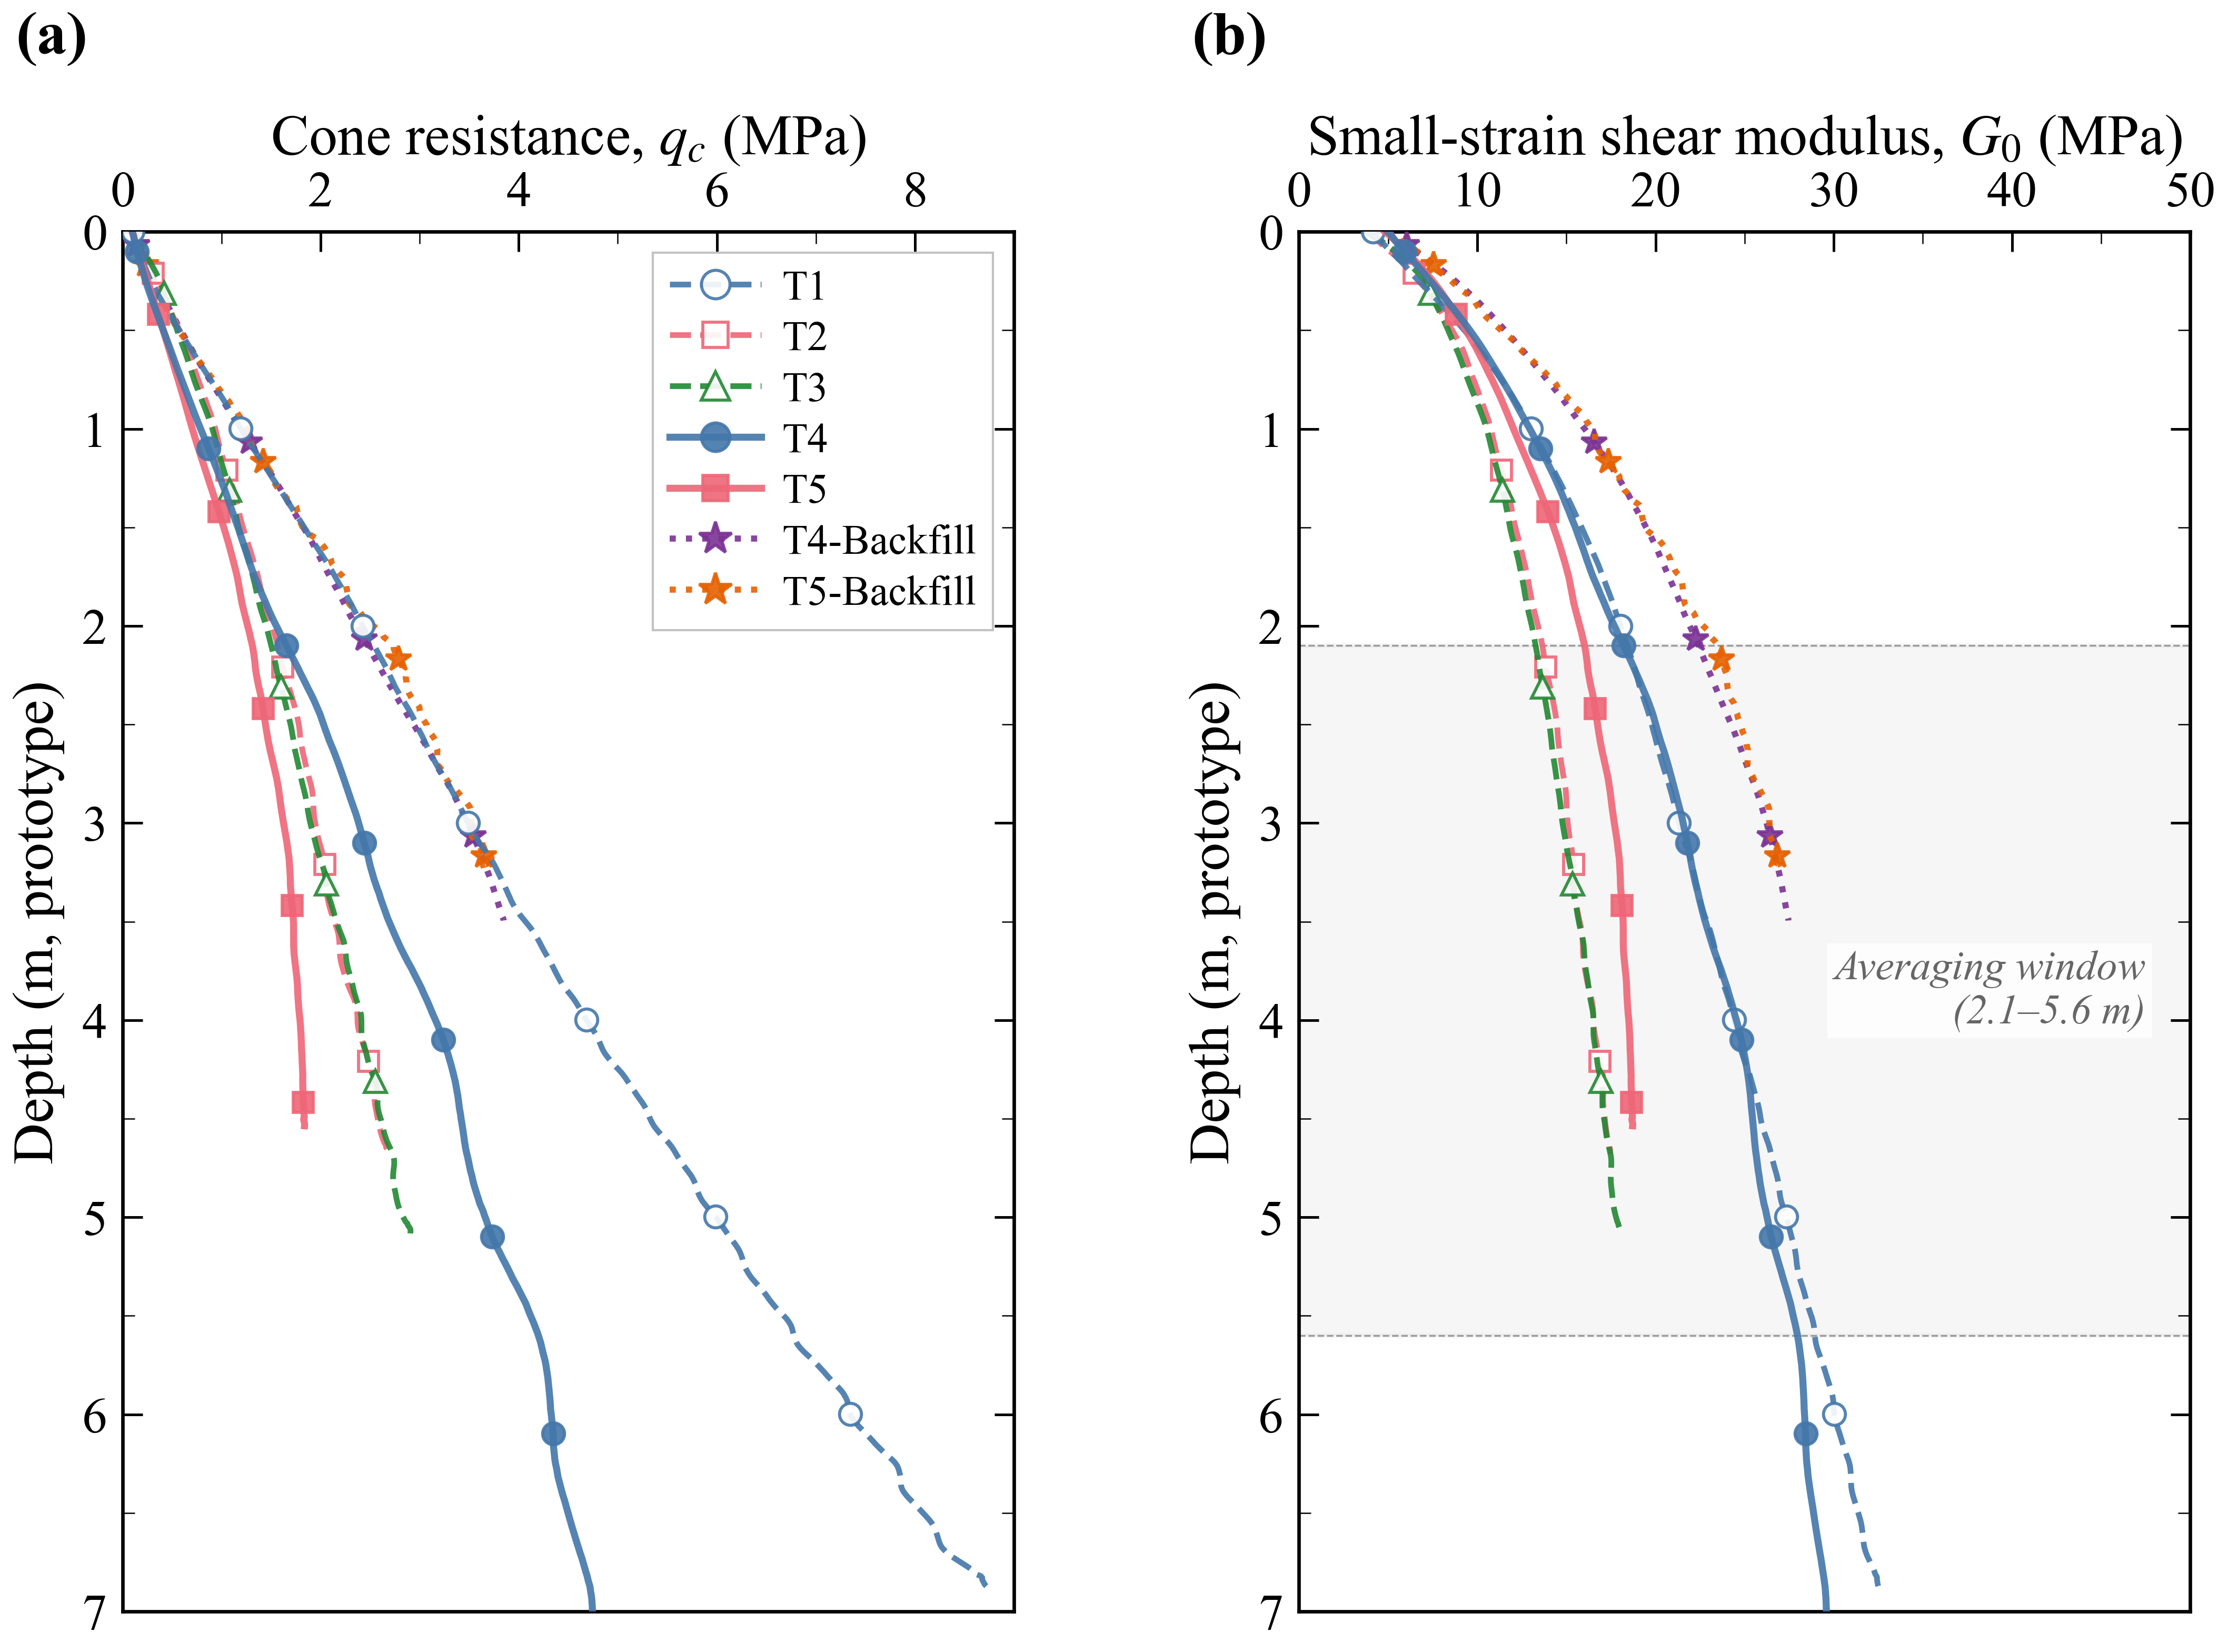
Figure 6: In-flight CPT depth profiles. (a) Cone tip resistance \(q_c\). (b) Small-strain shear modulus \(G_0\).
Table 5: Mean soil properties from in-flight CPT, averaged over 30–80 mm model depth.
| T1 | T2 | T3 | T4 | T5 | BF\(^\dagger\) | |
|---|---|---|---|---|---|---|
| \(\bar{q}_c\) [MPa] | 4.80 | 2.36 | 2.32 | 2.60 | 1.90 | 3.22 |
| \(\bar{D}_r\) [%] | 84.9 | 61.1 | 58.6 | 75.1 | 61.8 | 88.5 |
| \(\bar{V}_s\) [m/s] | 120.6 | 103.2 | 102.7 | 105.2 | 98.2 | 111.1 |
| \(\bar{G}_0\) [MPa] | 24.3 | 16.4 | 16.1 | 22.2 | 18.9 | 25.3 |
| \(\gamma'\) [kN/m\(^3\)] | 16.3\(^\ddagger\) | 15.1\(^\ddagger\) | 15.0\(^\ddagger\) | 9.82\(^\S\) | 9.41\(^\S\) | 10.3\(^\S\) |
| \(\phi'\) [°] | 39.1 | 36.1 | 35.5 | 39.3 | 37.3 | 41.5 |
\(^\dagger\) Mean of T4-5 and T5-5 backfill CPT, truncated to \(\leq 50\) mm. \(^\ddagger\) Dry unit weight. \(^\S\) Submerged unit weight.
The intended density contrast was confirmed: T4 (\(\bar{q}_c = 2.60\) MPa, \(D_r = 75\)%) versus T5 (\(\bar{q}_c = 1.90\) MPa, \(D_r = 62\)%). The saturated series showed systematically lower \(q_c\) than the corresponding dry series at matched density: T1 (dense dry) reached 4.80 MPa, nearly double T4 (dense saturated) at 2.60 MPa, consistent with the lower effective stress under submerged conditions. The No. 5 backfill produced higher cone resistance (\(\bar{q}_c = 3.22\) MPa) and stiffness (\(\bar{G}_0 = 25.3\) MPa) than the native No. 7 sand despite loose placement, owing to its coarser grain size (\(d_{50} = 1.99\) vs. 0.21 mm). This difference directly affects the frequency recovery discussed in Section 3.3.
Scour-Induced Frequency Decline¶
Under saturated conditions, the TSB foundation showed lower scour sensitivity: T4 (dense) declined by only 0.85% and T5 (loose) by 2.58% at \(S/D = 0.58\) (Table 6, Fig. 7). T4 declined steadily with decelerating increments (0.038 \(\to\) 0.029 \(\to\) 0.026 Hz), each well above the measurement noise floor. The diminishing response is consistent with progressively higher confining pressure beneath the scour front, which reduces the marginal stiffness contribution of each removed layer.
In contrast, T5 frequency decline accelerated. The frequency drop between \(S/D = 0.39\) and 0.58 (0.144 Hz) was 2.6 times larger than the initial drop between \(S/D = 0\) and 0.19 (0.056 Hz). Progressive scour in loose sand reduces the confining stress toward the threshold for nonlinear deformation, amplifying the frequency decline with each increment. Loose saturated sand (T5) was three times more sensitive than dense saturated sand (T4), and relative density had a larger effect than saturation state.
Table 6
(a) Natural frequency and normalised frequency change for all 22 test cases.
| Test ID | Condition | (S/D) |
(f_{1,\text{model}}) (Hz) |
(f_{1,\text{proto}}) (Hz) |
(\Delta f/f_0) (%) |
|---|---|---|---|---|---|
| T1-1 | 0.00 | 11.200 | 0.160 | 0.00 | |
| T1-2 | Dense dry | 0.20 | 10.990 | 0.157 | (-1.88) |
| T1-3 | 0.34 | 10.850 | 0.155 | (-3.13) |
|
| T1-4 | 0.49 | 10.640 | 0.152 | (-5.00) |
|
| T2-1 | 0.00 | 10.640 | 0.152 | 0.00 | |
| T2-2 | Loose dry | 0.30 | 10.500 | 0.150 | (-1.32) |
| T2-3 | 0.43 | 10.360 | 0.148 | (-2.63) |
|
| T2-4 | 0.61 | 10.080 | 0.144 | (-5.26) |
|
| T3-1 | 0.00 | 10.780 | 0.154 | 0.00 | |
| T3-2 | Sand–silt | 0.29 | 10.570 | 0.151 | (-1.95) |
| T3-3 | 0.49 | 10.360 | 0.148 | (-3.90) |
|
| T3-4 | 0.56 | 10.220 | 0.146 | (-5.19) |
|
| T4-1 | 0.00 | 10.919 | 0.156 | 0.00 | |
| T4-2 | 0.19 | 10.881 | 0.155 | (-0.35) |
|
| T4-3 | Dense sat. | 0.39 | 10.852 | 0.155 | (-0.61) |
| T4-4 | 0.58 | 10.826 | 0.155 | (-0.85) |
|
| T4-5 | BF(^\dagger) |
10.864 | 0.155 | (-0.50) |
|
| T5-1 | 0.00 | 10.779 | 0.154 | 0.00 | |
| T5-2 | 0.19 | 10.723 | 0.153 | (-0.52) |
|
| T5-3 | Loose sat. | 0.39 | 10.645 | 0.152 | (-1.24) |
| T5-4 | 0.58 | 10.501 | 0.150 | (-2.58) |
|
| T5-5 | BF(^\dagger) |
10.940 | 0.156 | (+1.49) |
\(^\dagger\) BF = backfill with No. 5 sand;
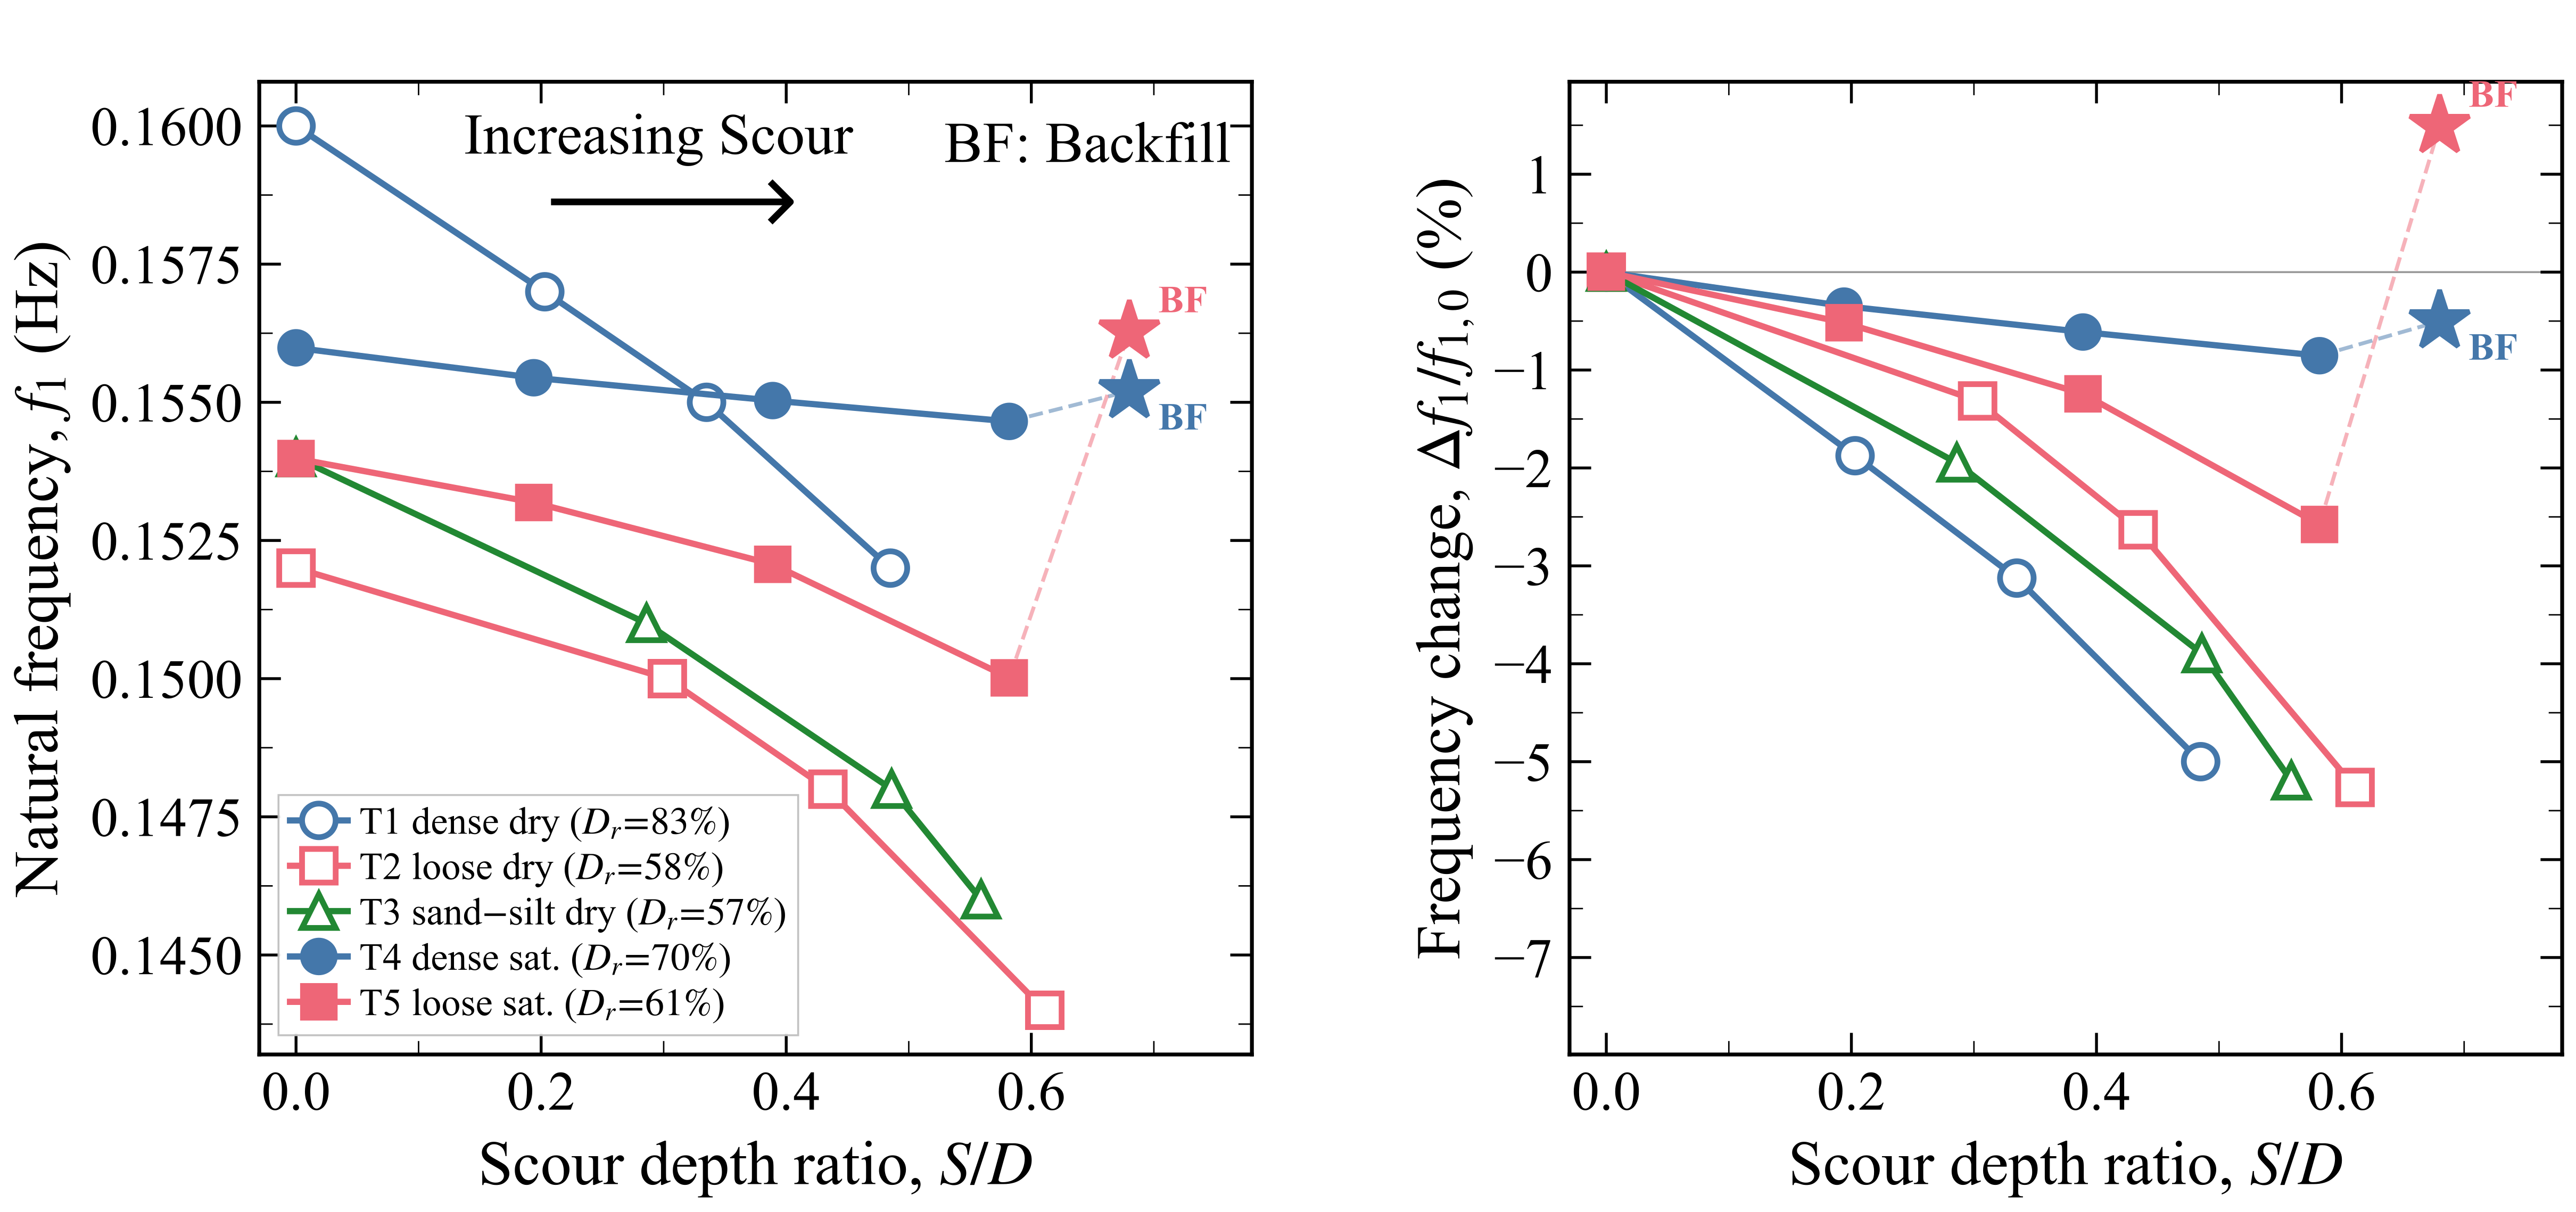
Figure 7: Effect of scour depth ratio on natural frequency across five centrifuge test series: (a) \(f_1\) versus \(S/D\); (b) normalised frequency change \(\Delta f_1/f_{1,0}\) (%) versus \(S/D\).
Backfill Recovery¶
After the maximum-scour stage, the scour holes were infilled with pre-saturated No. 5 sand and the model re-spun to \(70g\). The backfill recovery ratio \(R\) quantifies the fraction of lost frequency that was restored:
As can be seen below, there is a difference in the recovery states between the two tests. T4 (dense) recovered 41% of its frequency loss (\(R = 0.41\)), whereas T5 (loose) exceeded the pre-scour baseline (\(R = 1.58\)). Because backfill stiffness (\(\bar{G}_0 = 25.3\) MPa) falls between loose (\(18.9\) MPa) and dense (\(22.2\) MPa) No. 7 sand, it over-compensates in the loose case and under-compensates in the dense case. The post-backfill frequency therefore depends on the backfill stiffness, not on how well the hole was filled (Fig. 8). The ratio \(G_{0,\text{BF}}/G_{0,\text{native}}\) controls whether the frequency under-recovers, matches, or overshoots the baseline.
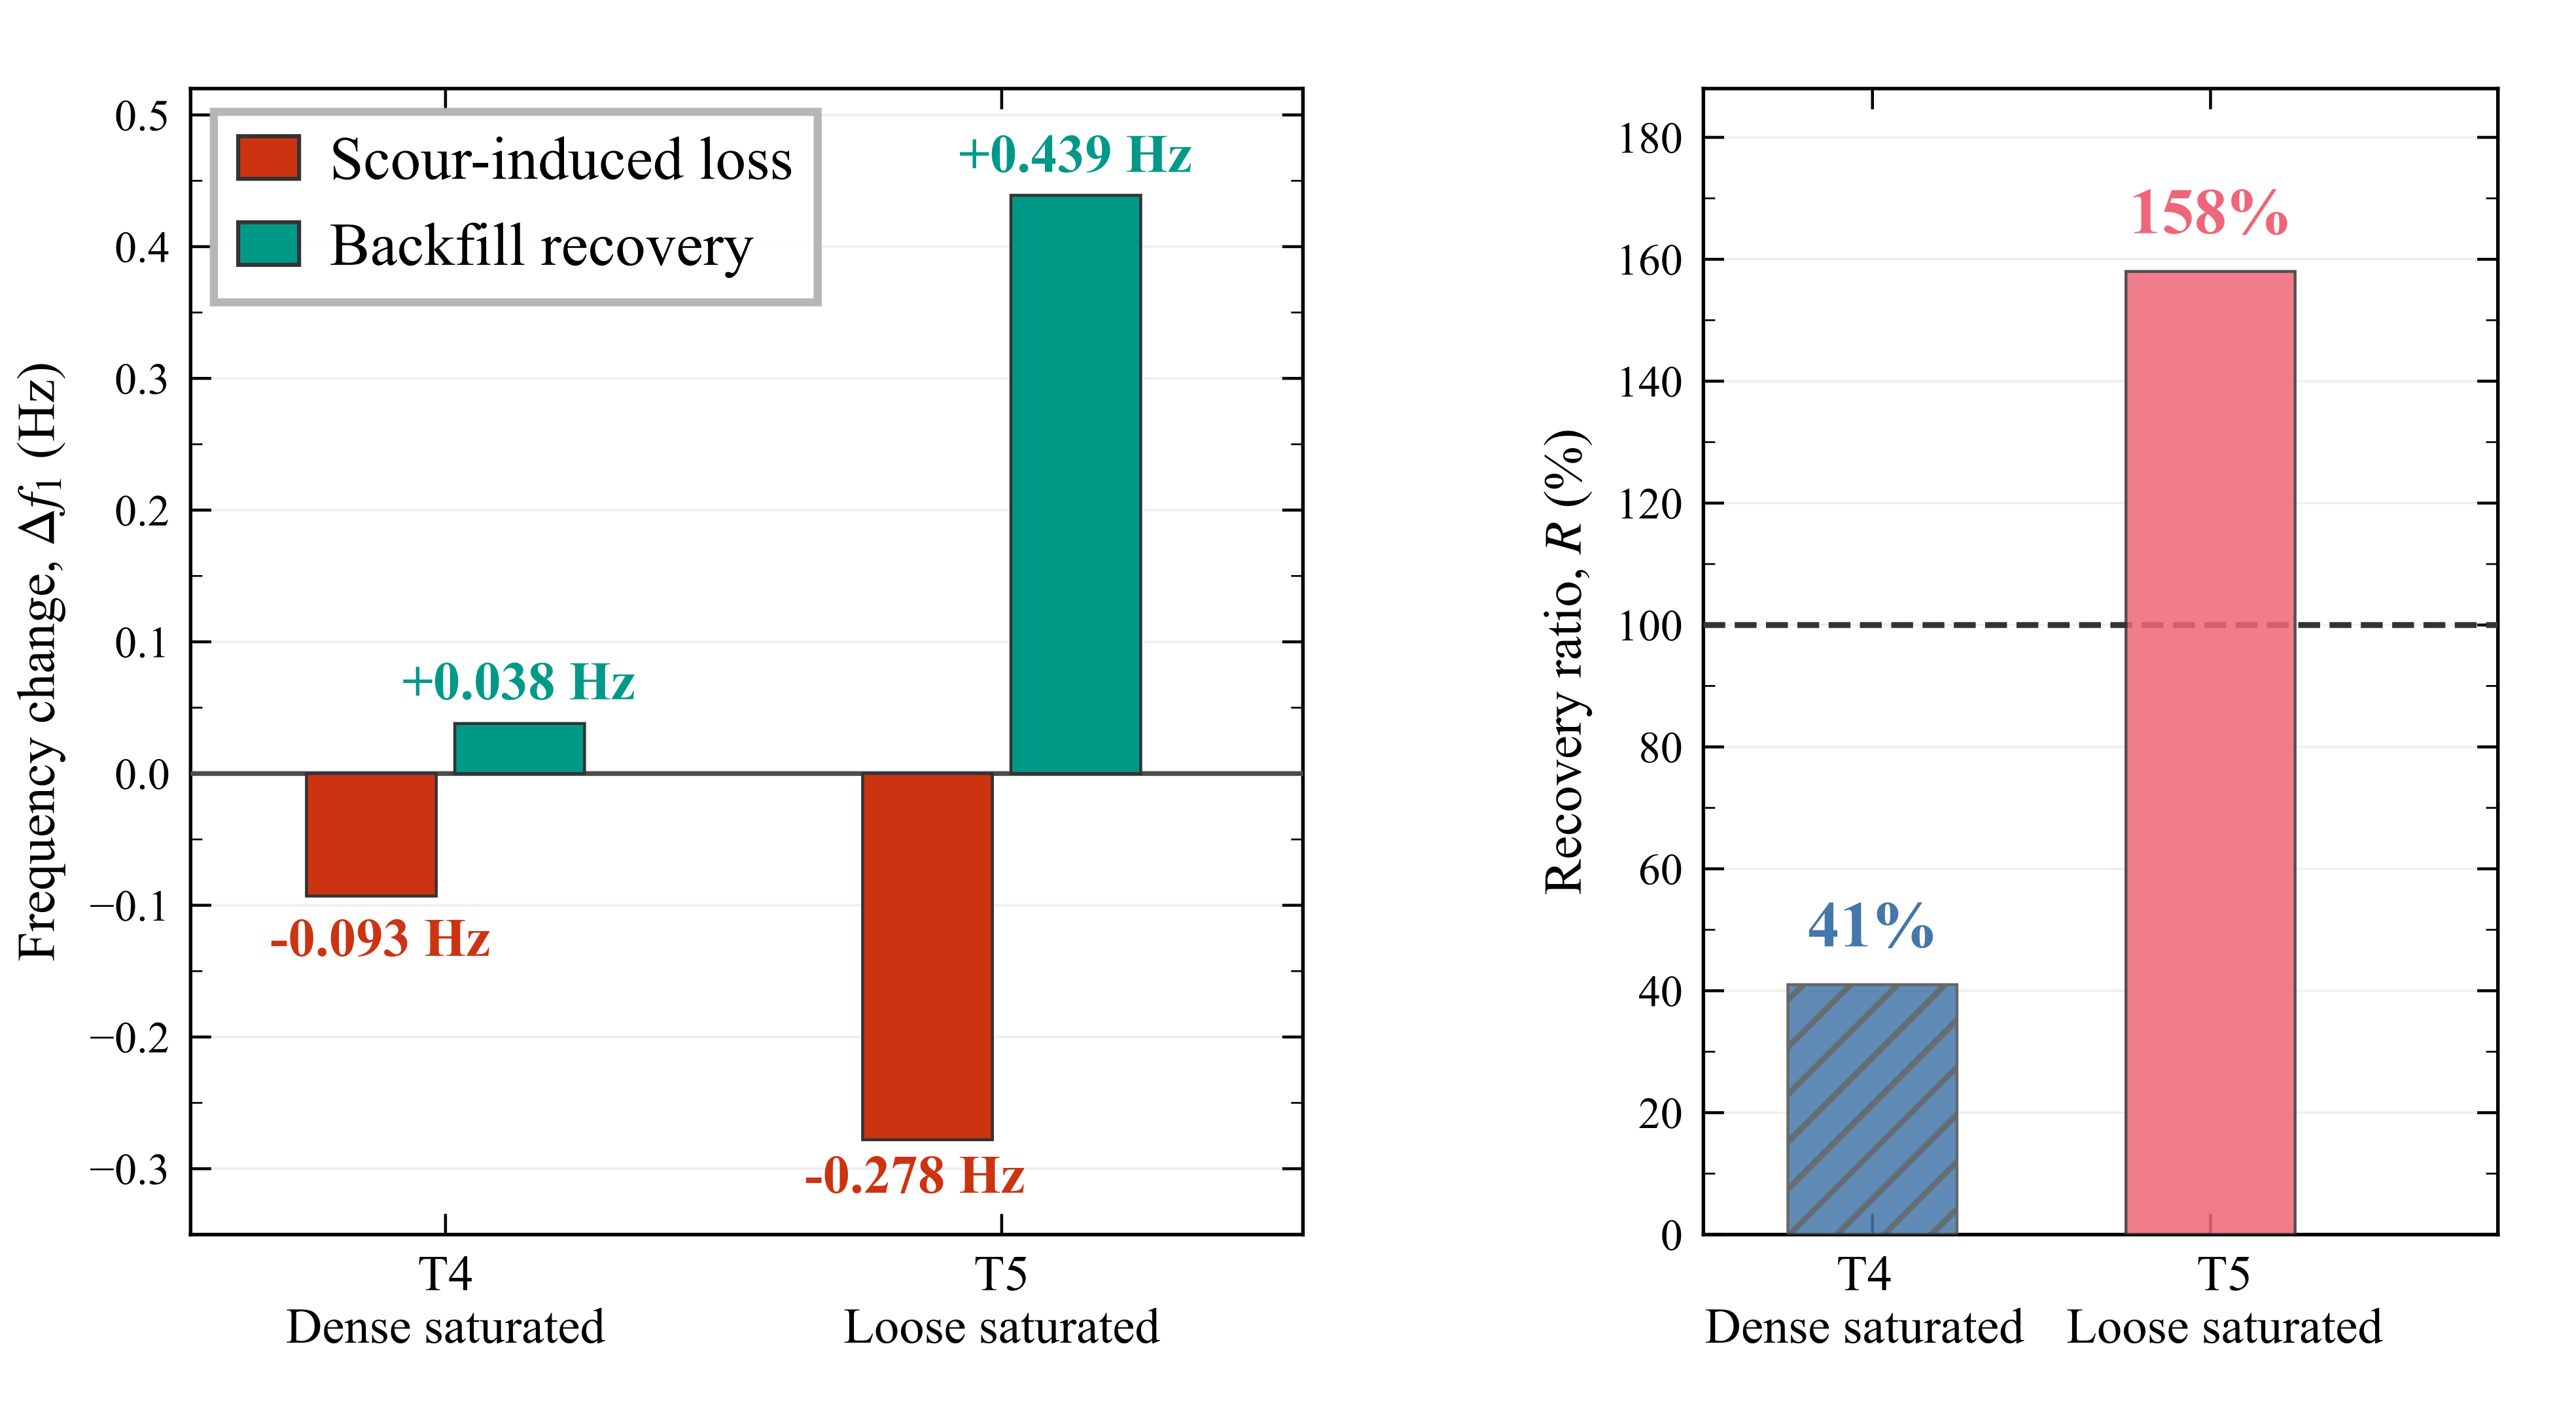
Figure 8: Illustration of a backfill recovery. (a) Frequency waterfall chart for T4 and T5 test cases. (b) Recovery ratio for two different soil densities
Structural Response Beyond Frequency¶
Tower displacement, bottom bending strain, and bucket cap settlement were tracked alongside the natural frequency at each scour stage. The normalised RMS (Root-Mean-Square) displacement \(\bar{u}_i\) at scour stage \(i\) is the ratio of the RMS tower displacement to its baseline value, both taken over the steady-state excitation window:
A value of \(\bar{u}_i > 1\) indicates that the tower displacement has grown relative to the intact condition. Bottom bending strain change is expressed as the percentage deviation from baseline at the lowest strain gauge elevation:
The tower average normalised RMS displacement increased by a factor of 4.27 in T5 at \(S/D = 0.58\), a 327% increase that accompanied only a 2.58% frequency change (Fig. 9 a). This \(4.27\) value is the mean of six tower LVDT channels computed over the full steady-state recording; one channel (D2) was excluded because it exhibited anomalous amplification (\(93\) baseline) inconsistent with all adjacent sensors, indicating sensor malfunction. The amplification was not uniform along the tower height: the lowest sensor (D1, near the mudline) showed a full-record RMS ratio of \(5.8\), while the nacelle sensor showed only a \(1.2\) increase. This height-dependent distribution is consistent with rigid-body rotation about the foundation level rather than cantilever bending, which would produce maximum displacement at the tower top.
Bottom bending strain distinguishes the two response regimes (Fig. 9 b). In both series, initial scour (\(S/D = 0.19\)) increased bottom strain by 16% in T4 and 21% in T5, consistent with downward migration of the effective fixity point as surface soil is removed. In T4, this elevated strain persisted through maximum scour (\(+10\)% at \(S/D = 0.58\)): the foundation remained elastic, and the tower continued to bend as a cantilever with a lowered fixity point. In T5, bottom strain reversed: the \(+21\)% amplification became \(-11\)% at \(S/D = 0.58\), dropping below the pre-scour baseline. Fig. 11 illustrates the two structural modes schematically.
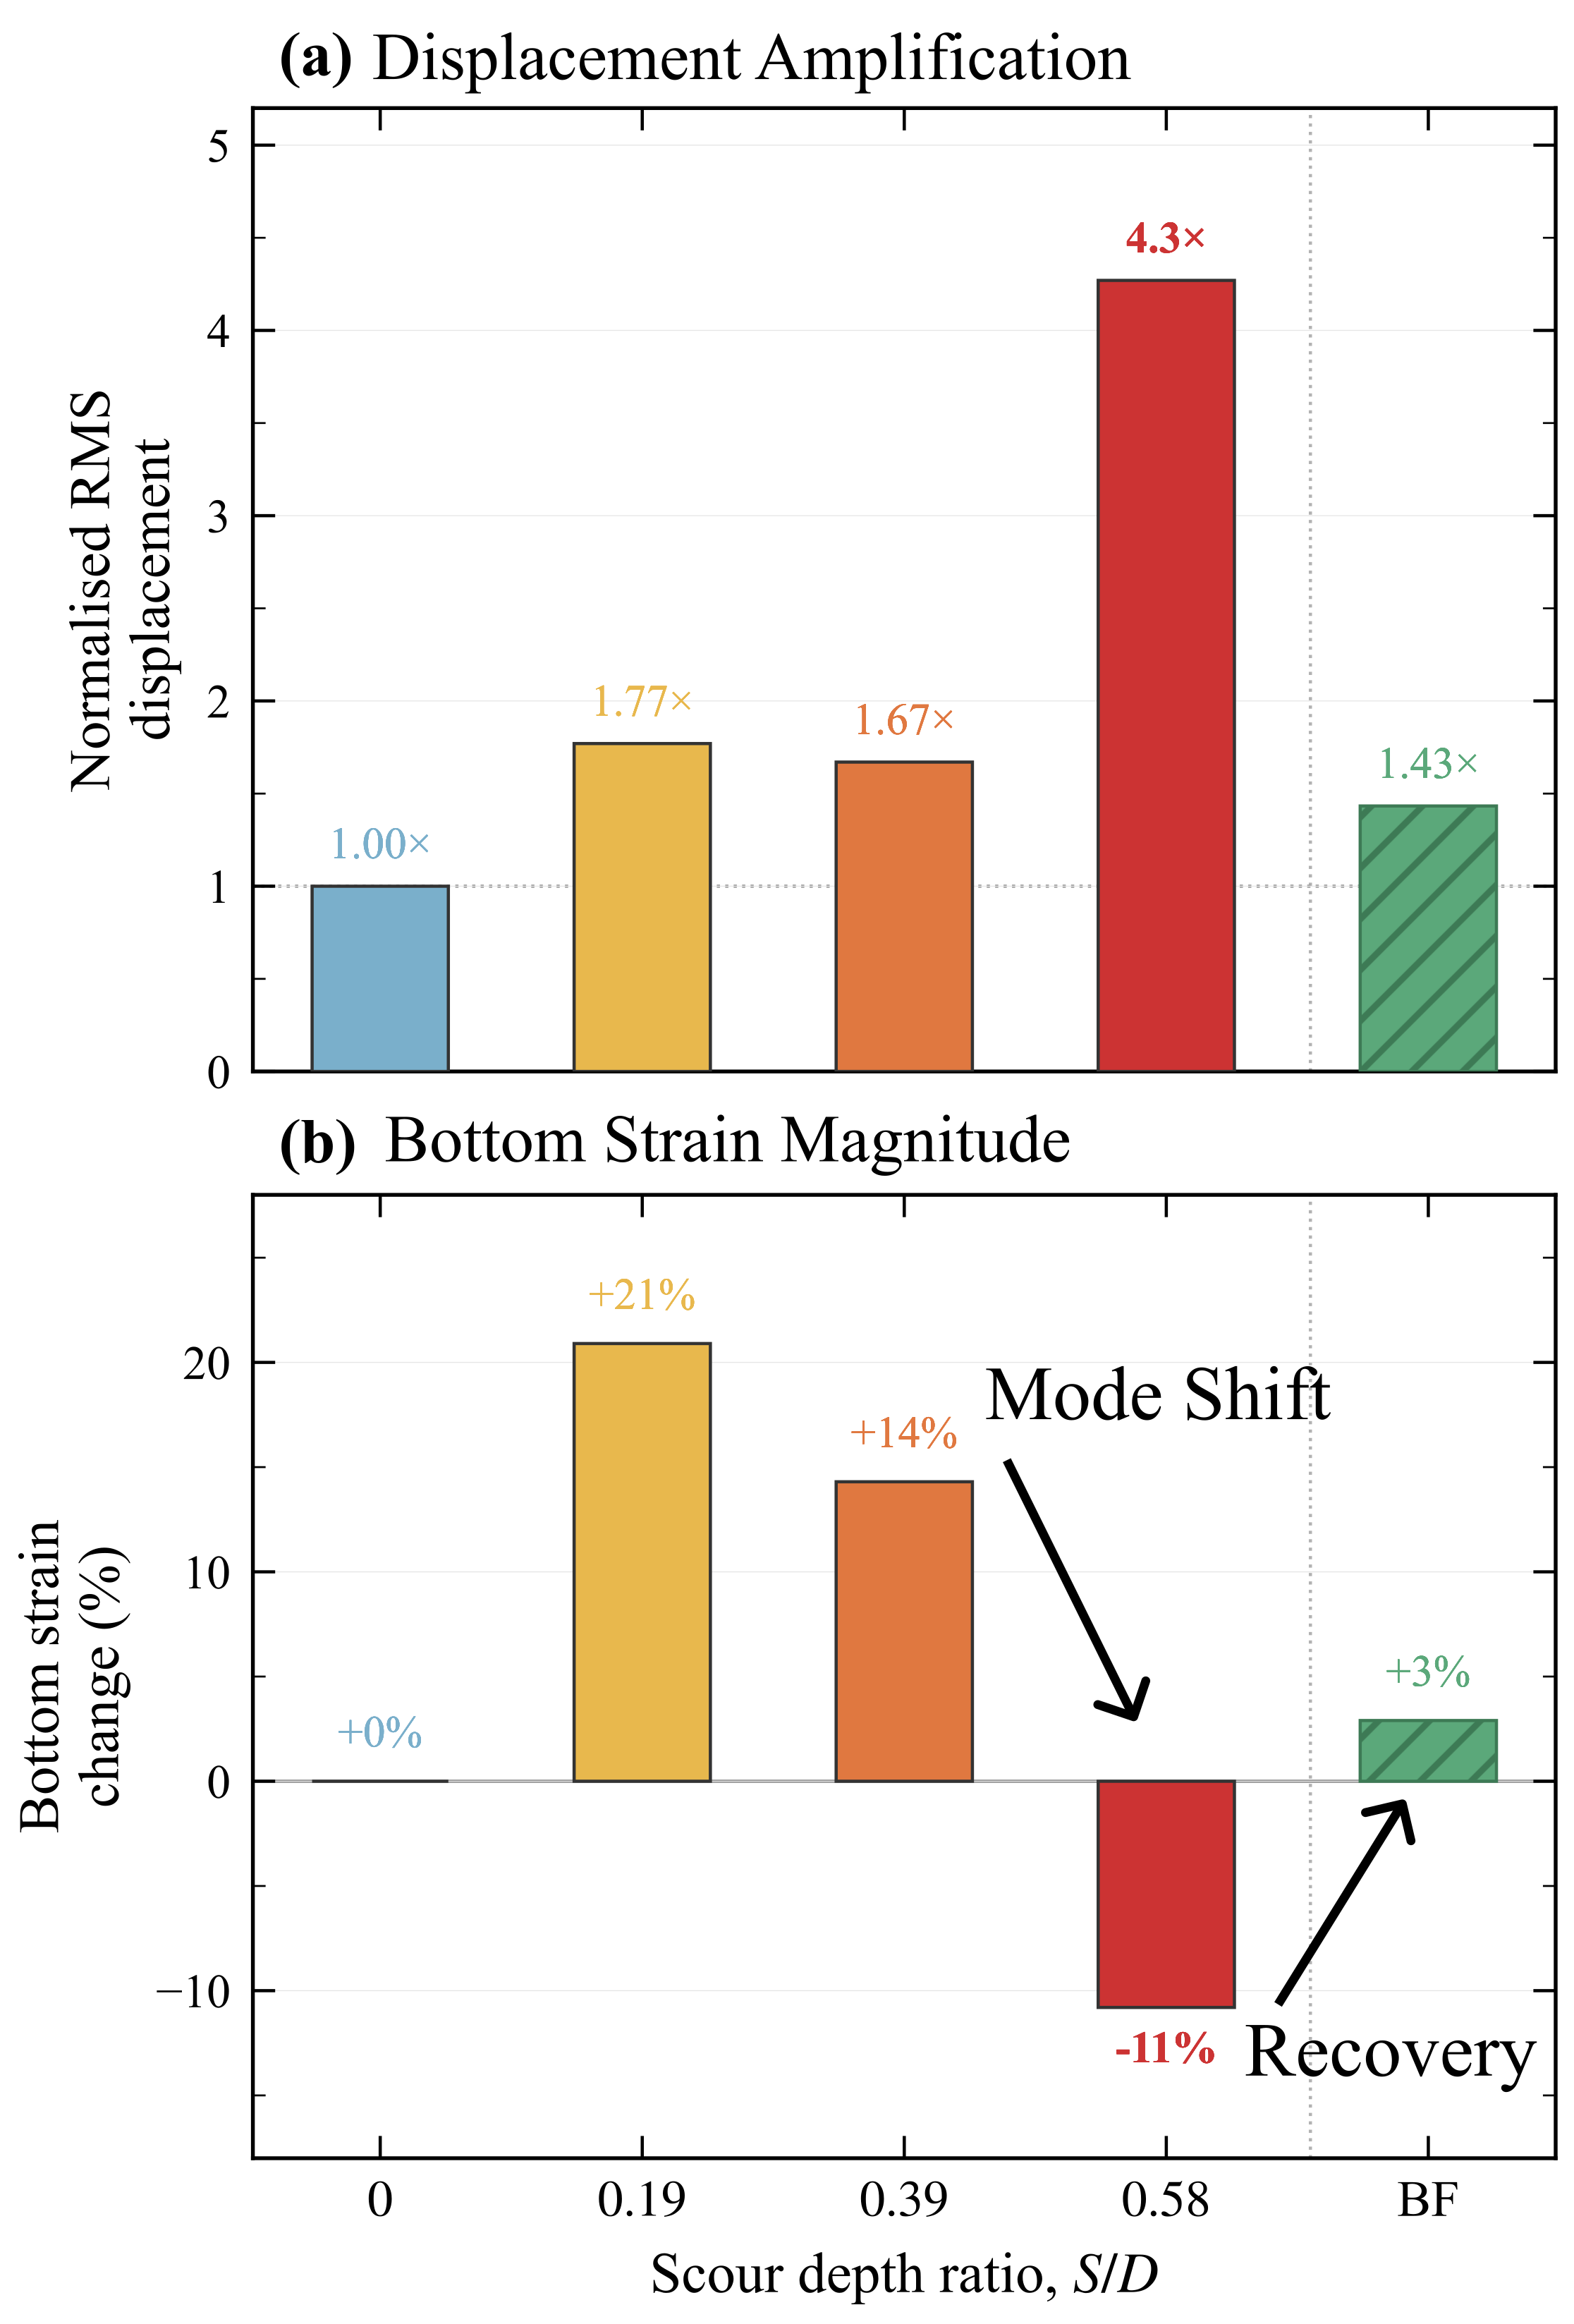
Figure 9: Evolution of structural response under progressive scour and backfill recovery: (a) normalised RMS displacement \(\bar{u}/\bar{u}_0\); (b) bottom bending strain change \(\Delta\varepsilon/\varepsilon_0\).
The transition was abrupt rather than gradual: between \(S/D = 0.39\) and \(0.58\), the displacement indicator jumped from \(1.67\) to \(4.27\) times, the strain indicator reversed sign, and the settlement rate accelerated. One of seven tower laser LVDTs at different heights produced anomalous readings and was excluded from the tower-average displacement; the reported \(4.27\) times amplification is the mean of six channels. The convergence of all three indicators points to a qualitative regime change from elastic cantilever bending to rigid-body foundation tilting (Fig. 11). The governing mechanism is examined in Section 4.1.
The abruptness itself warrants explanation, because a smoothly degrading
foundation would be expected to produce smoothly changing response
indicators. Three overlapping factors concentrate the transition into a
narrow \(S/D\) band: first, the demand-to-capacity ratio for the upwind
bucket is a strongly nonlinear function of scour depth because capacity
degrades approximately linearly with \((L-S)\) while the cyclic demand
grows quadratically with the scour-induced reduction in lateral
stiffness, so the ratio crosses the 50–70% threshold for nonlinear onset
(Taeseri et al., 2019) over a scour increment of only
\(\Delta(S/D) \approx 0.2\); second, once the upwind bucket yields, the
effective base of the tripod reduces from the full spacing
\(L_{\mathrm{base}}\) to the distance between the two remaining elastic
buckets, which drops the moment arm and accelerates the yielded-bucket
strain increment in a single post-yield increment; third, asymmetric
kinematic locking emerges — the yielded bucket cannot transfer tension,
so the system can only tilt about it, which geometrically prohibits an
intermediate response regime between elastic bending and rigid-body
tilting. The combination of these three factors produces the step-change
observed in the displacement, strain-reversal, and settlement indicators
between \(S/D = 0.39\) and \(0.58\). The time-series behaviour at both
states is shown in
Fig. 9; the raw
acceleration and strain records from which these indicators are
extracted are archived in the supplementary dataset
data/year2_2025/T5/T5-3 (elastic state) and data/year2_2025/T5/T5-4
(post-transition state) for independent inspection.
After backfill, T5 displacement recovered from a factor of 4.27 to 1.43 (67% reduction) and bottom strain returned to \(+2.9\)%, above baseline and consistent with elastic bending behaviour (Fig. 9). The backfill restored sufficient bearing capacity to bring the foundation back below the tilting threshold. For monitoring system design, strain reversal after a sustained increase constitutes a direct warning signal: the soil under the critical bucket has reached its bearing capacity.
Bucket cap settlement is the cumulative static vertical displacement measured by LVDTs at each of the three bucket caps (A, B, C), referenced to the pre-scour position. In T4, displacement remained stable throughout (normalised RMS range 0.989–1.063) with negligible bucket cap movements (\(|\Delta| < 0.04\) mm). In T5, asymmetric settlement developed despite symmetric scour: bucket A accumulated 13.2 mm while bucket B showed negligible movement (\(< 0.3\) mm). Bucket A is positioned opposite to the actuator force direction and therefore experiences the highest cyclic vertical compression under the push-pull moment transfer, making it the first bucket to approach bearing capacity mobilisation. The asymmetric settlement confirms preferential foundation tilting about the least-loaded bucket. Fig. 10 presents these three indicators across all scour stages.
Despite the mirror symmetry of the tripod about the A–B axis (Fig. 3), buckets B and C recorded different settlement histories at matched scour stages in T5. The cumulative B–C settlement difference at \(S/D = 0.58\) is 4.2 mm at model scale (294 mm at prototype scale), which is smaller than the primary A–B difference of 12.9 mm (901 mm prototype) attributable to the push-pull couple mechanism along the actuator-aligned axis. The B–C residual has three contributing factors. First, the APA actuator-vector can depart from the pure A–B axis by an estimated \(\pm 2°\)–\(5°\) due to mount tolerance at the tower-top node; a \(5°\) out-of-axis component projects \(\sin 5° \approx 8.7\%\) of the push-pull amplitude onto the B–C axis, producing a secondary cyclic couple between B and C that accumulates differential settlement over many loading cycles. Second, out-of-plane rigid-body rotation emerges during the bending-to-tilting mechanism transition discussed in Section 4.1: once the upwind bucket A yields, the foundation can tilt about an axis that is not strictly along the A–B line, and the resulting small out-of-plane component concentrates additional cyclic compression on C relative to B. Third, the centrifuge sand-bed preparation procedure admits scatter on the order of \(\pm 2\)–\(5\%\) in relative density across the 1.0 m soil-box footprint; the single edge-box in-flight CPT verifies the bulk soil state at the test-bed level but does not resolve spatial variability between the three bucket positions. The observed B–C difference is consistent with the sum of these three contributions and does not imply a separate failure mechanism. A future programme that places in-flight CPT adjacent to each of the three bucket positions would resolve the factor (iii) component directly and tighten the envelope-bound quoted here.
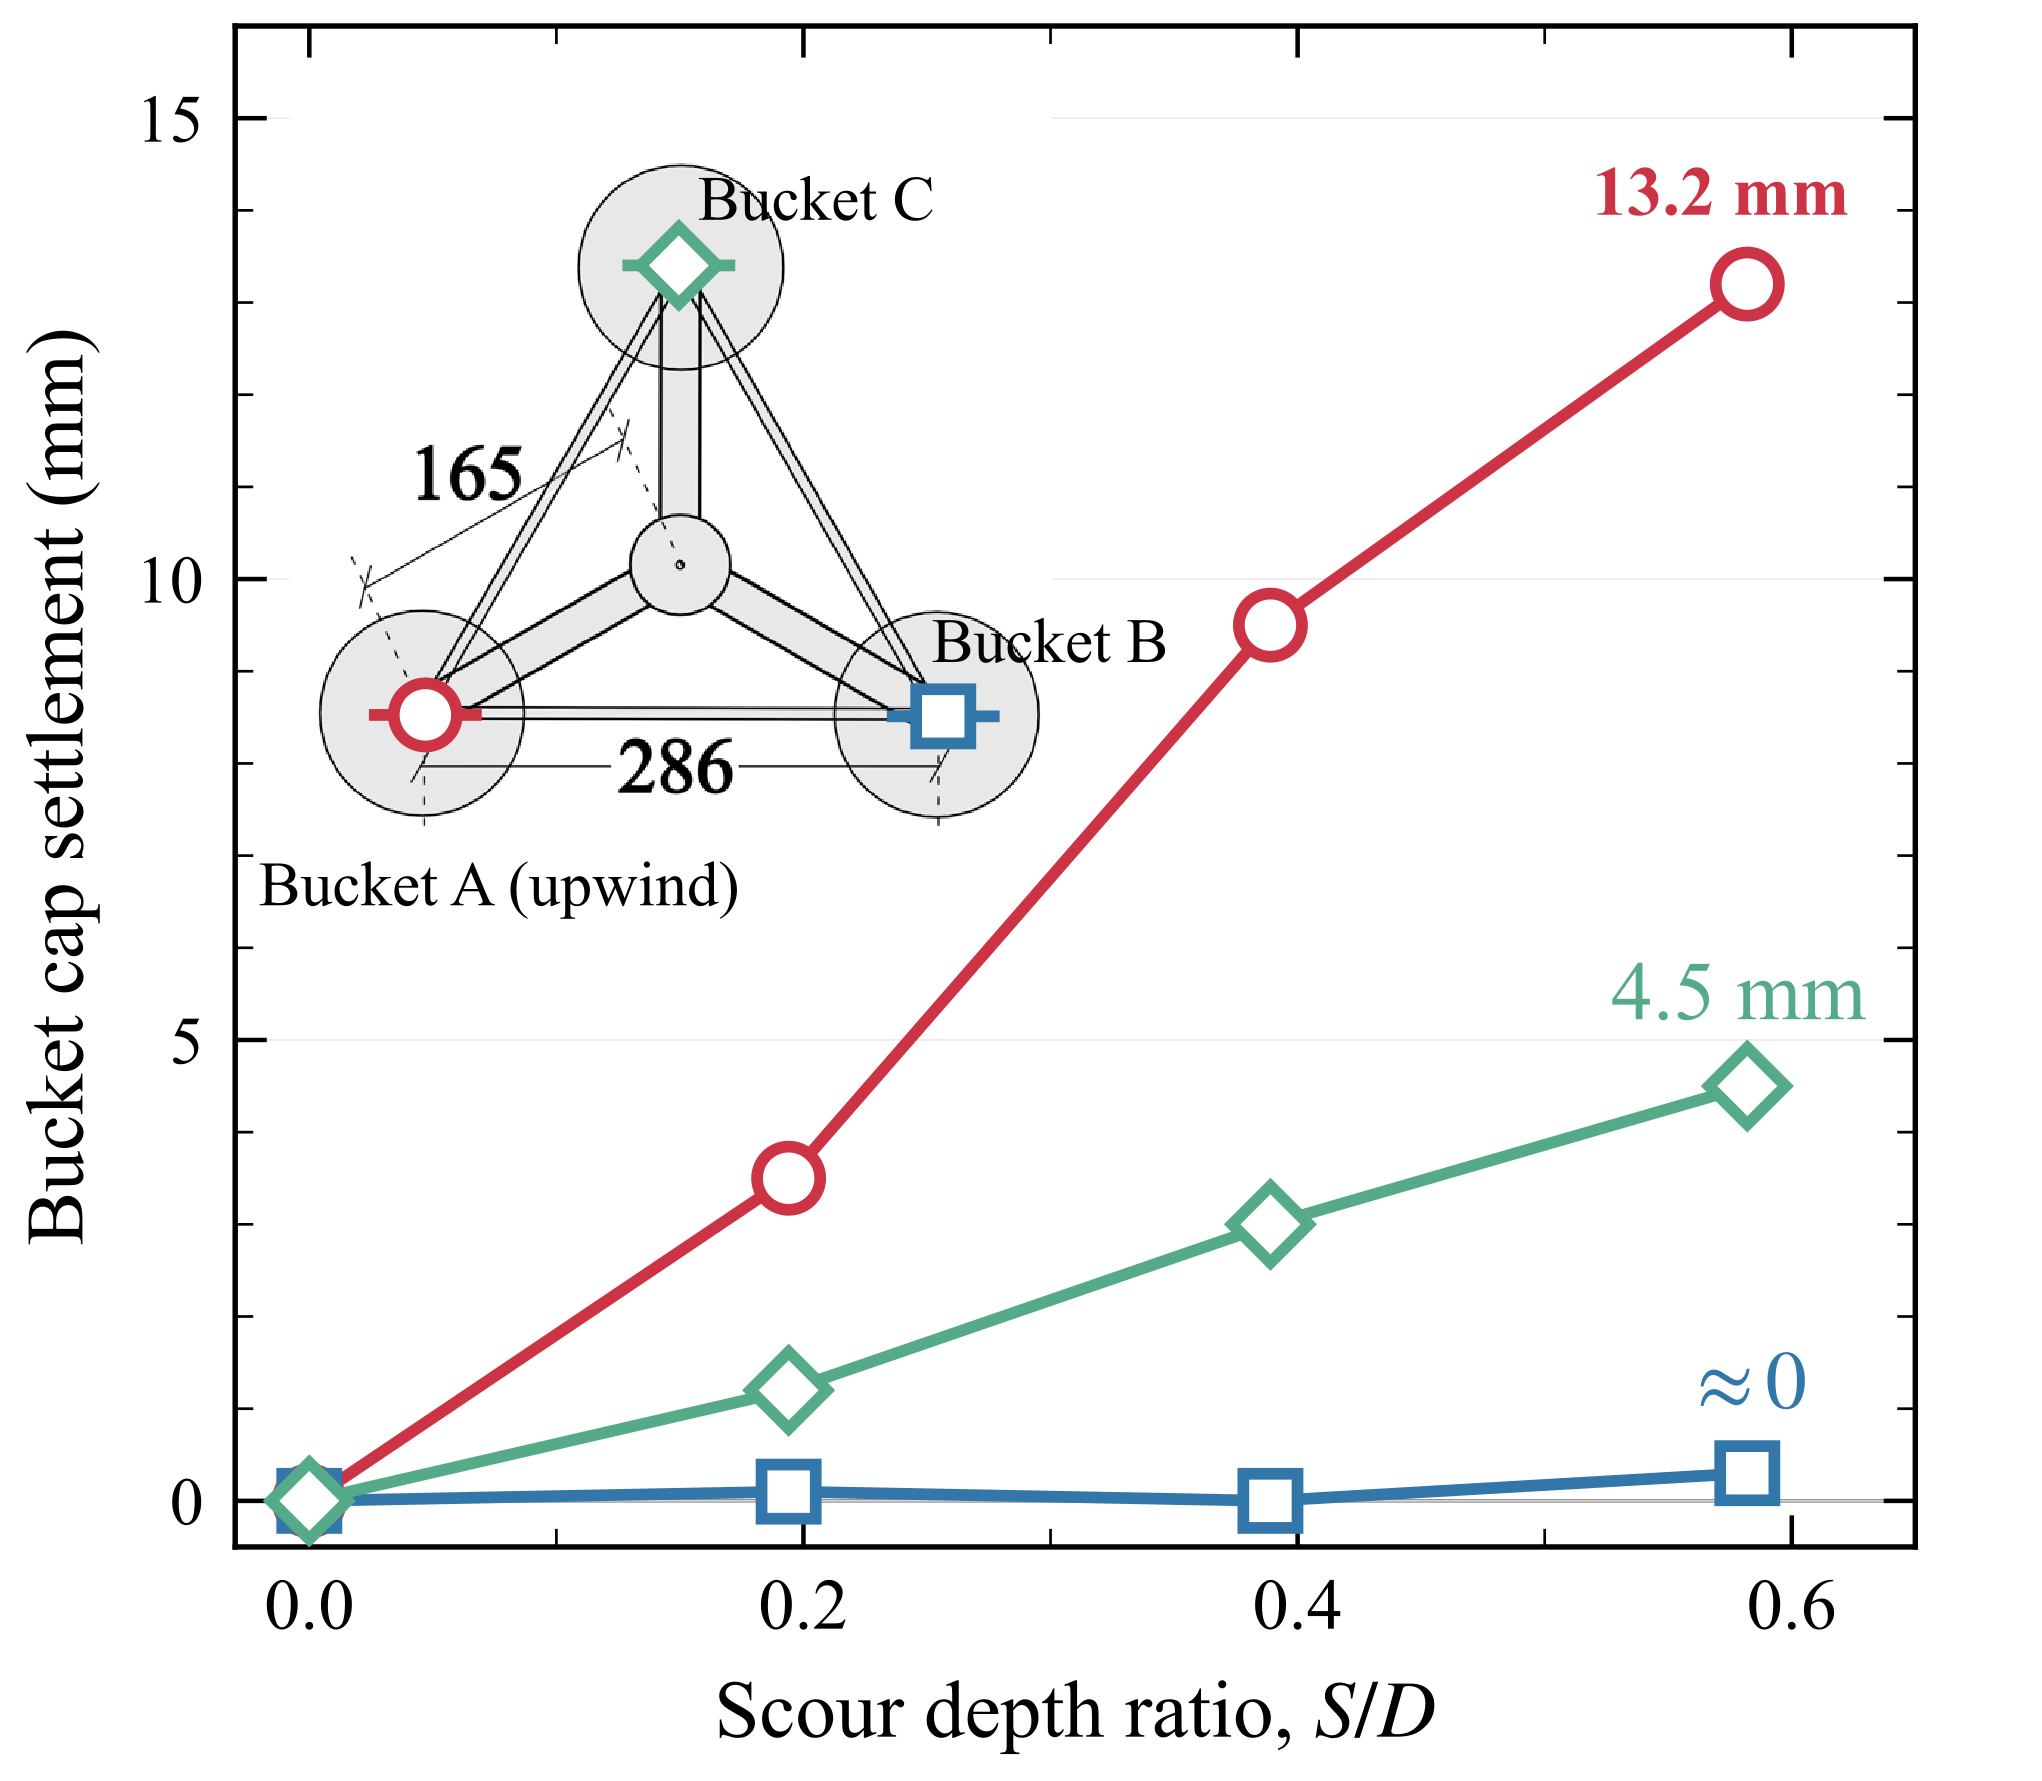
Figure 10: Asymmetric bucket cap settlement accumulation in under symmetric scour.
Discussion¶
Bending-to-Tilting Transition Mechanism¶
The simultaneous displacement amplification and strain reversal observed in T5 at \(S/D = 0.58\) point to a qualitative change in how the foundation carries load. In the elastic regime (\(S/D \leq 0.39\)), scour removes surface soil and lowers the effective fixity point of the embedded foundation. The tower responds as a cantilever with increasing free length: bottom bending strain increases (longer moment arm) and nacelle displacement grows moderately (higher compliance). The soil beneath each bucket remains in the elastic range and the response scales proportionally with scour depth. At \(S/D = 0.58\) in loose sand, the foundation stops bending and starts tilting.
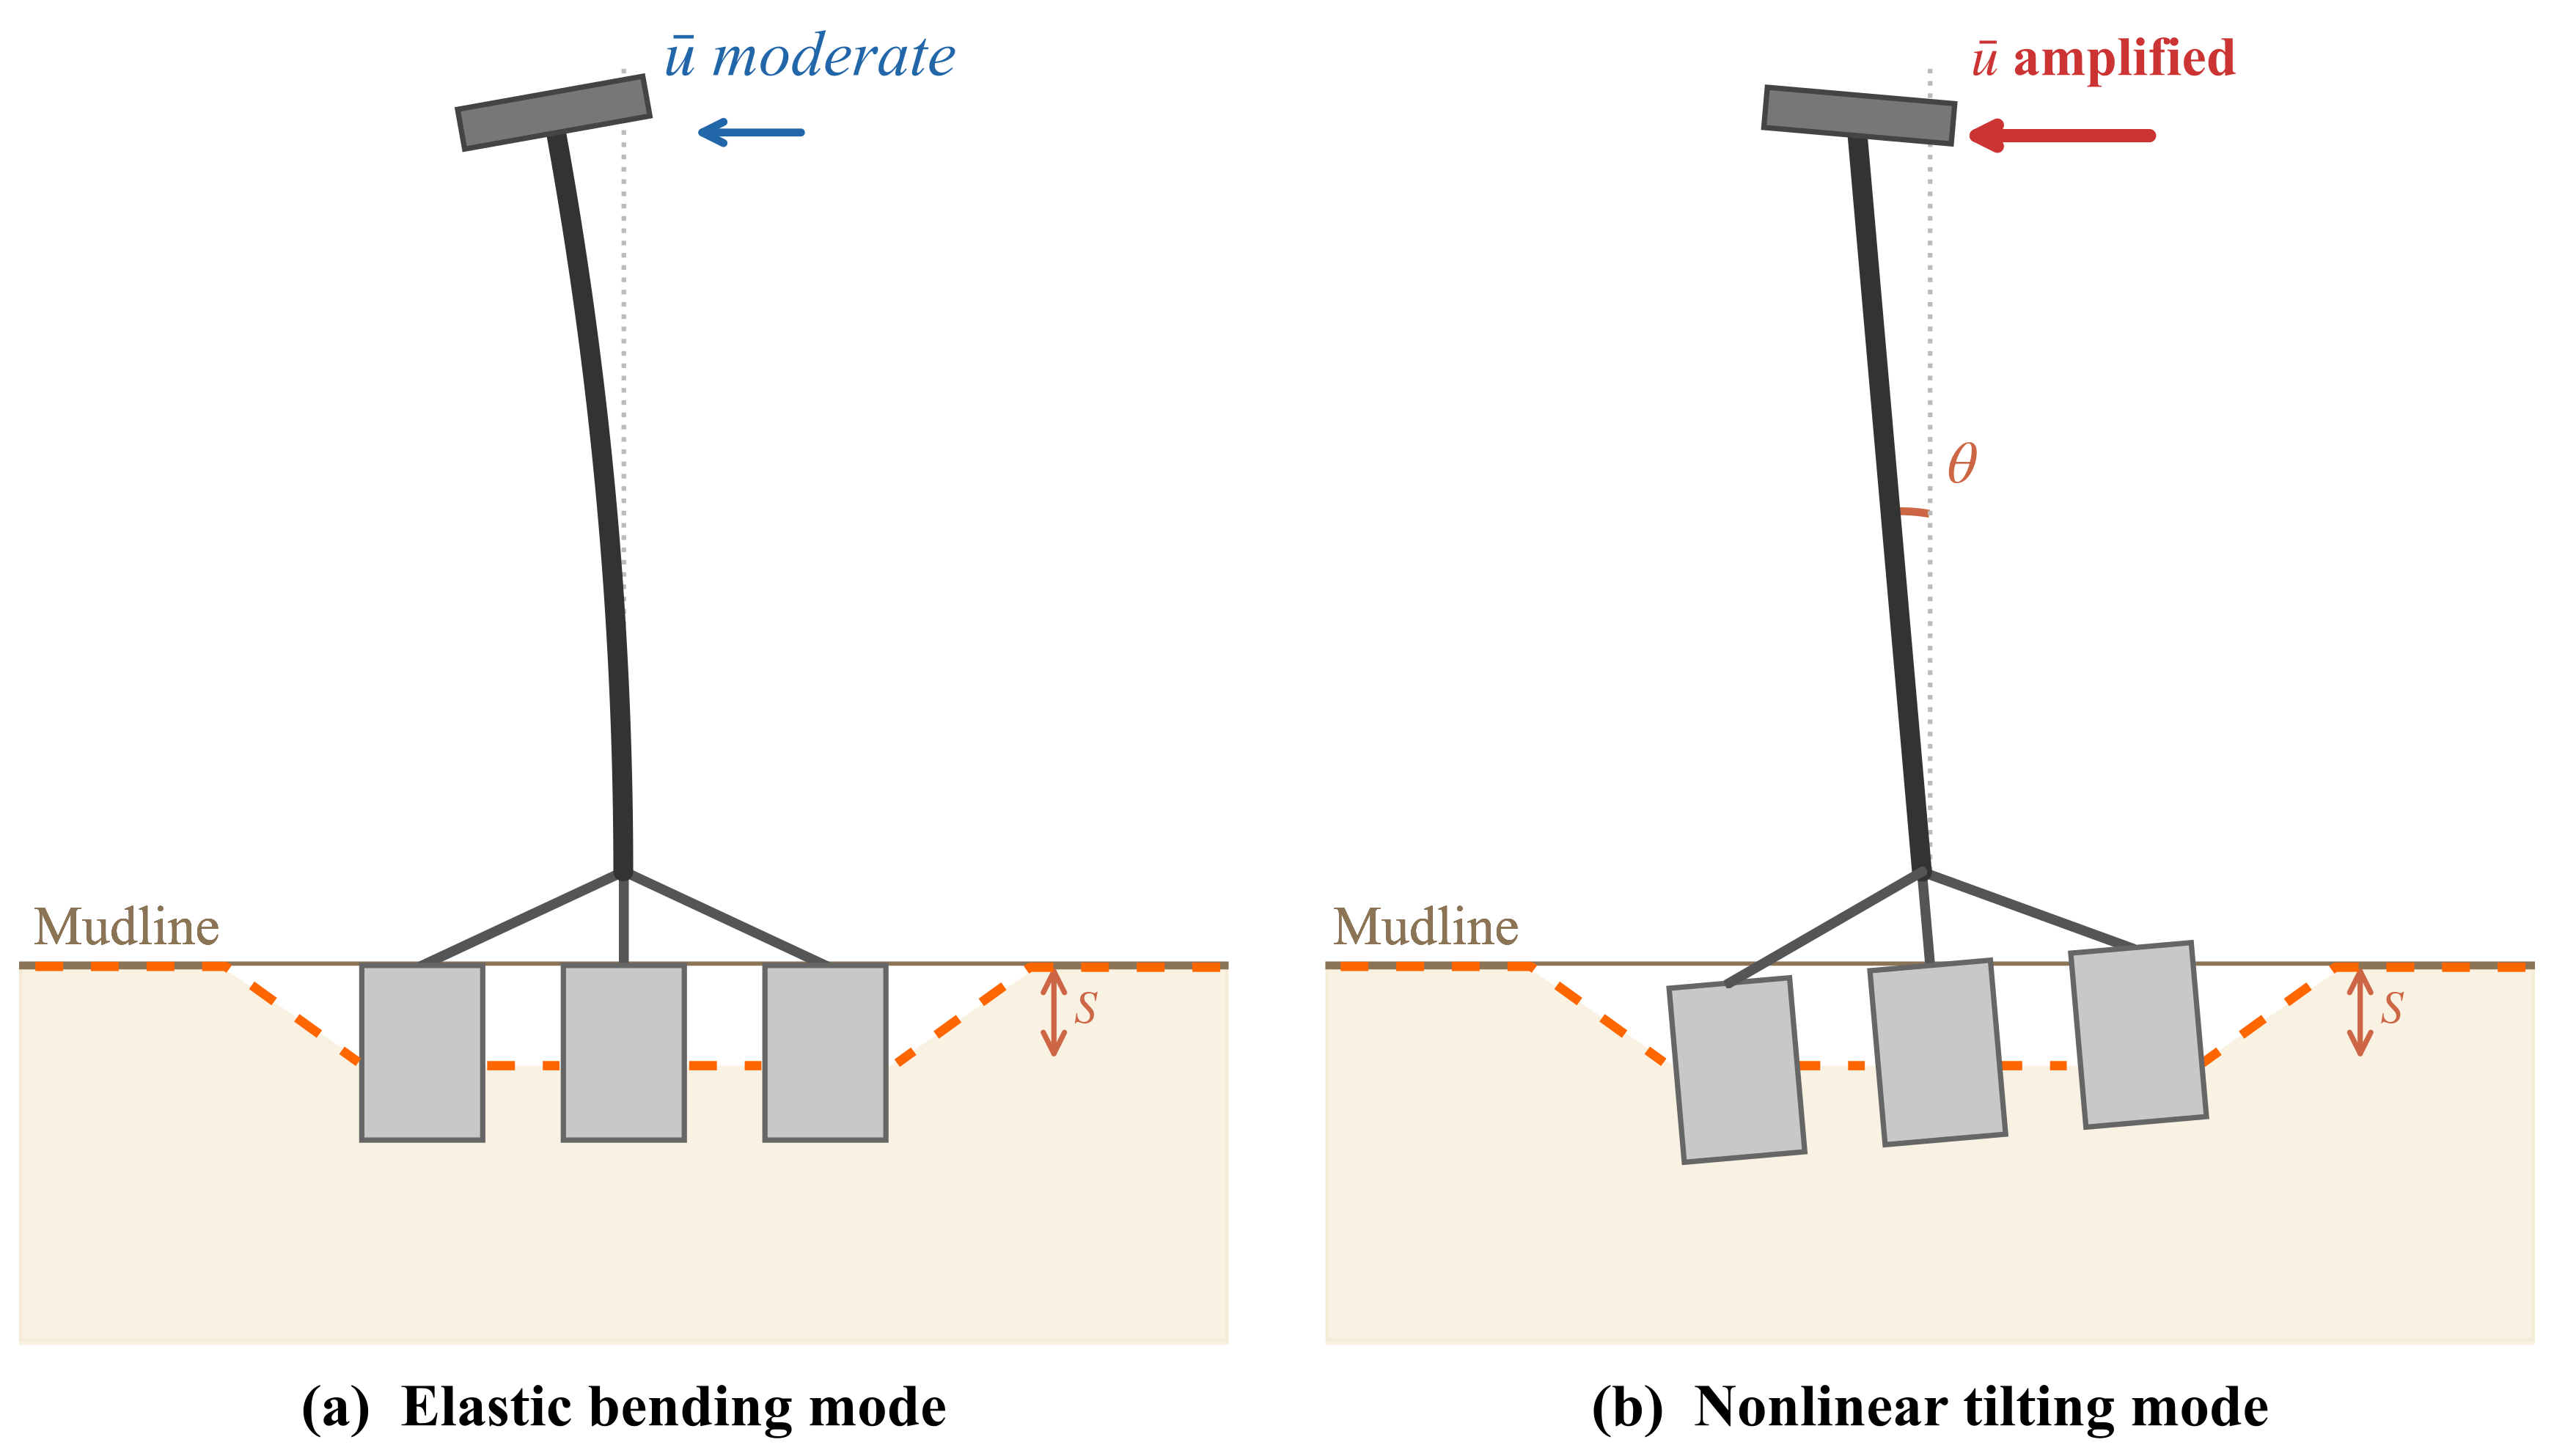
Figure 11: Schematic illustration of the two distinct response modes: (a) elastic bending of the tower; (b) nonlinear rigid-body tilting at the foundation.
The vertical bearing capacity of a skirted foundation depends on the effective overburden at the embedded length. Fig. 12 illustrates the problem formulation: for a suction bucket of diameter \(D = 2R = 8\) m with skirt length \(L = 9.3\) m, the drained vertical capacity follows the skirted footing formulation (Villalobos et al. (2009)):
where the first term captures the depth-dependent overburden contribution and the second the width-dependent base resistance. Scour of depth \(S\) reduces the effective embedment, so the residual capacity becomes:
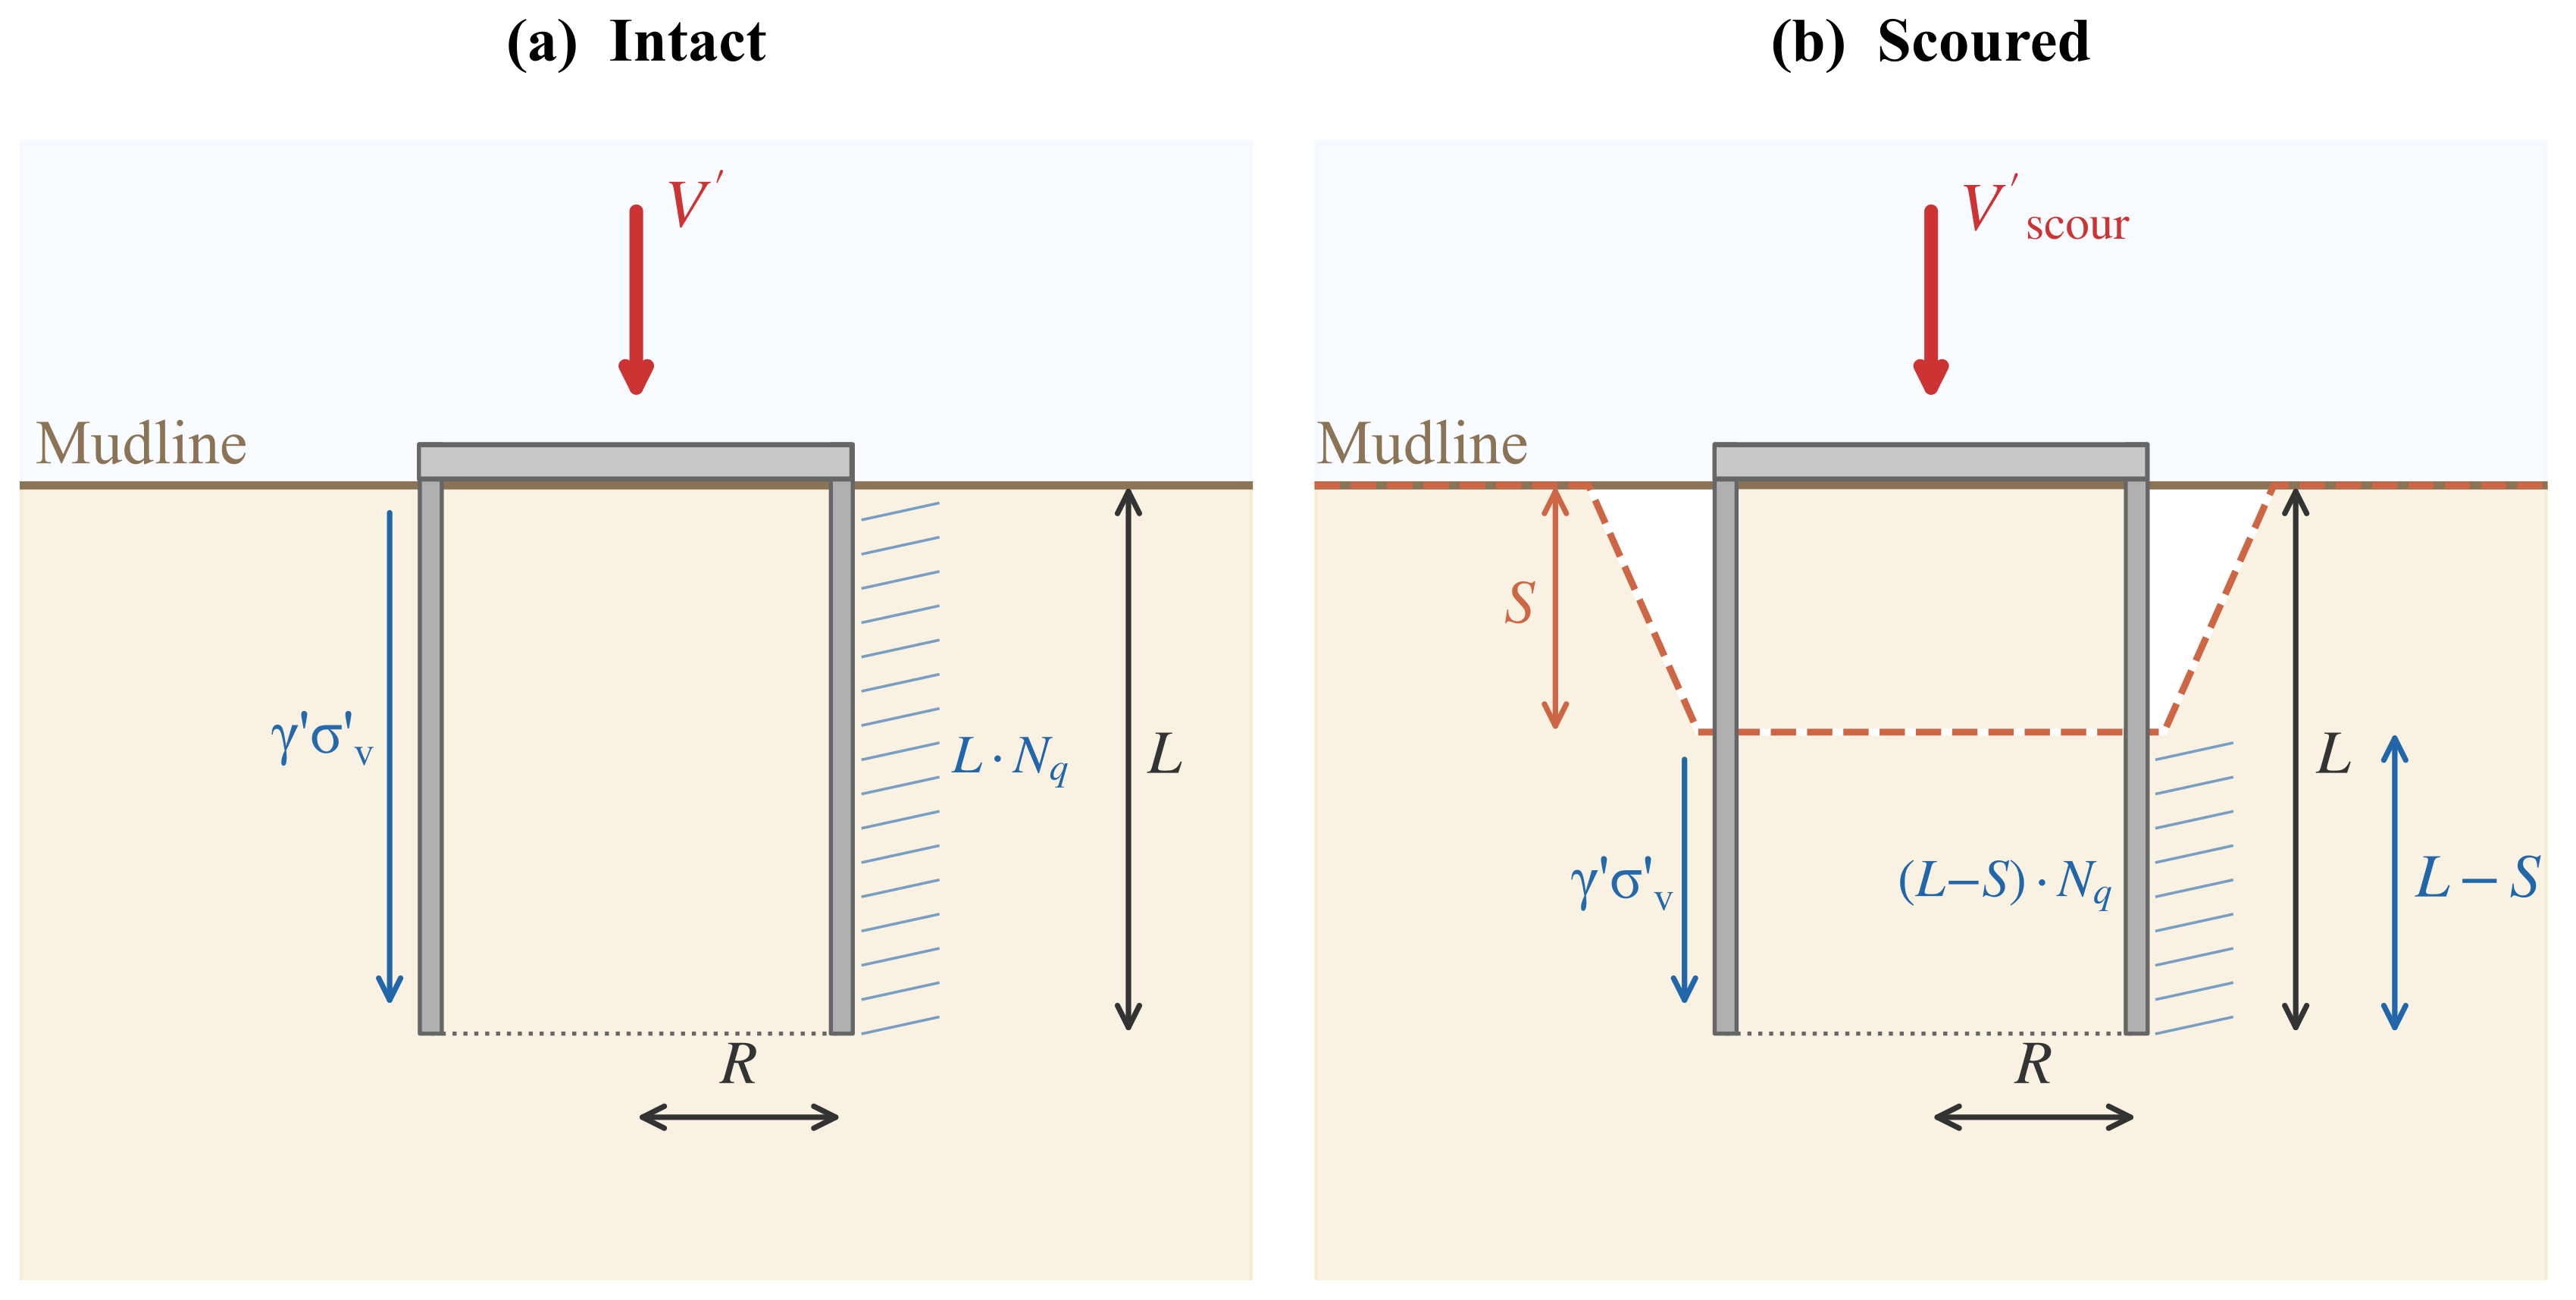
Figure 12: Bearing capacity formulation for a suction bucket foundation in (a) Intact condition and (b) Scoured condition.
Scour erodes the depth-dependent term (\(L \cdot N_q\)) but leaves the width-dependent term (\(0.4R \cdot N_\gamma\)) unchanged. Using CPT-derived friction angles (\(\phi' = 35.5°\) for T5, \(37.5°\) for T4) and corresponding bearing capacity factors (\(N_q = 35\), \(N_\gamma = 52\) for T5; \(N_q = 46\), \(N_\gamma = 72\) for T4), scour to \(S/D = 0.58\) (\(S = 4.7\) m) reduces both foundations to approximately 60% of their intact capacity. However, T4 retains 34% higher absolute capacity than T5 at the same scour depth (\(q_{u,\text{T4}}/q_{u,\text{T5}} \approx 1.34\)), because the higher friction angle produces larger bearing capacity factors in both terms.
Under tripod moment loading, each bucket experiences cyclic vertical compression and tension through the push-pull couple. The upwind bucket (Bucket A) receives the highest cyclic compression. In T5 at \(S/D = 0.58\), the scour-reduced capacity at Bucket A can no longer sustain the cyclic demand — the soil spring yields, and the foundation transitions from elastic bending to rigid-body tilting.
When the tripod rotates as a whole, each bucket does not only translate vertically: every point of the superstructure above the rotation axis also translates horizontally. For the measured T5 response at \(S/D = 0.58\), the differential settlement between buckets A and B (13.2 mm against 0.3 mm at model scale) bounds the rigid-body tilt angle at \(\theta \approx \arctan(12.9/d_{AB}) \approx 3°\) at model scale, where \(d_{AB}\) is the perpendicular distance from A to the axis of rotation (which lies between the two elastic buckets B and C). Because each bucket cap sits at or near the mudline — approximately at the elevation of the rotation axis — the horizontal translation at the bucket cap is second-order in the tilt angle (\(\sim r (1 - \cos\theta)\), of order 0.1 mm at model scale) and not directly observable against the cyclic amplitudes. The primary horizontal kinematic signature is instead concentrated on the superstructure above the mudline, where a point at height \(h\) above the rotation axis translates horizontally by \(h \sin\theta\). For the tower top at \(h \approx 1{,}400\) mm above the mudline, this amounts to roughly 73 mm at model scale (5.1 m at prototype) for a \(3°\) tilt. This signature is what the height-graded tower laser LVDTs record: the sensor near the mudline (D1) returns a \(5.8\times\) baseline RMS ratio, while the nacelle sensor returns only \(1.2\times\). The larger ratio at the mudline is explained by the pre-scour baseline being dominated by cantilever bending (near-zero amplitude at the mudline, large at the nacelle); once rigid-body tilt is superposed on the cantilever signature, the absolute amplitude at the mudline grows from near-zero to a measurable value, producing the large relative amplification. The asymmetric bucket settlement in Figure 7 and the height-graded tower displacement in Fig. 9 a are therefore two projections of the same kinematic event — rigid-body tilt of the superstructure about an axis near or below the mudline — so that the vertical settlement at each bucket and the horizontal displacement at each tower elevation are not independent degrees of freedom but are coupled through the tilt angle.
Once the upwind bucket yields, the foundation loses its distributed moment resistance. The rotational stiffness of a tripod depends on the product \(k_v \cdot L_\text{base}^2\) (Eq. 10); when \(k_v\) at one bucket drops to near-zero (plastic state), the effective base reduces from the full tripod spacing to the distance between the remaining elastic buckets. The structure tilts as a rigid body about the yielded bucket: the nacelle displaces because base rotation is amplified over the tower height, bottom bending strain drops because the tower translates rather than flexes, and settlement concentrates at the yielded bucket. Beyond the capacity reduction, scour also shifts the effective load reference point downward, further degrading the rotational stiffness coupling between horizontal and moment loading (Houlsby, 2016).
The sharp transition at \(S/D = 0.39\)–\(0.58\) is consistent with the known nonlinear onset at 50–70% of ultimate bearing capacity for shallow foundations on sand (Taeseri et al., 2019). The T5 foundation at \(S/D = 0.39\) was below this threshold; at \(S/D = 0.58\), the additional 11 kPa of overburden removal pushed the demand-to-capacity ratio past the critical value. The dense sand (T4) never reached this threshold because the higher friction angle and dilatancy provide a substantially larger capacity margin.
A modest density difference (\(D_r = 70\)% versus 61%, as measured by in-flight CPT) was enough to produce a qualitative change in the failure mechanism. The transition is governed by a capacity threshold, not a proportional stiffness relationship. A foundation that appears to respond linearly at moderate scour depths can abruptly shift to a tilting mode if the next scour increment crosses the bearing capacity threshold at the critical bucket. This nonlinearity is not captured by frequency monitoring alone: the 2.58% frequency decline at \(S/D = 0.58\) in T5 gives no indication that the foundation is in a different response regime from T4’s 0.85% decline.
Comparison with Published Data¶
The measured scour sensitivities were compared against published monopile and multi-footing data (Table 7, Fig. 14). Zaaijer (2006) predicted 2.4% frequency reduction for a monopile and 0.8% for a tripod at \(S/D = 1.0\) using analytical models calibrated to the Irene Vorrink and Lely wind farms. Weijtjens et al. (2016) reported 2–4% variation from SCADA monitoring at Belwind (\(S/D = 0.3\)–\(0.5\)), and Prendergast et al. (2015) measured 5–10% in laboratory soil removal tests at \(S/D = 1.0\).
Mayall et al. (2020) obtained 2.6–4.8% per pile diameter in saturated flume tests. Jawalageri et al. (2022) found 6–12% at \(S/D = 1.0\) from OpenFAST analyses across three sand densities. Tseng et al. (2018) obtained 3–6% at \(S/D = 1.5\) from field measurements on a met mast with monopile foundation in the Taiwan Strait. Across all these studies, the frequency decline steepens with scour depth, and no monopile study reports less than 2% reduction at \(S/D = 1.0\).
Table 7: (^\S) Jacket met mast on monopile ((D=3.8) m). SB = suction
bucket; TSB = tripod suction bucket.
(a) Comparison of scour-induced frequency decline across published studies.
| Source | Found. | Method | Soil | (S/D) |
(\Delta f_1/f_{1,0}) (%) |
|---|---|---|---|---|---|
| Zaaijer (2006) | Monopile | Analytical | – | 1.0 | 2.4 |
| Zaaijer (2006) | Tripod | Analytical | – | 1.0 | 0.8 |
| Mayall et al. (2020) | Monopile | 1(g) flume |
Sat. sand | 1.0 | 2.6–4.8 |
| Prendergast et al. (2015) | Monopile | 1(g) lab |
Dense dry | 1.0 | 5–10 |
| Weijtjens et al. (2016) | Monopile | Field | Sat. sand | 0.3–0.5 | 2–4 |
Tseng et al. (2018)(^\S) |
Monopile | Field+FEM | Sand | 1.5 | 3–6 |
| Jawalageri et al. (2022) | Monopile | Numerical | Loose–dense | 1.0 | 6–12 |
| Futai et al. (2018) | Monopile | Centrifuge 50(g) |
Dry sand | – | (f_n/f_\text{str})=0.50–0.59 |
| Ngo et al. (2022) | Jacket SB | Numerical | Dense sat. | 0.5 | 1–3 |
| Kim et al. (2025a) | TSB | Centrifuge 70(g) |
Dry sand | 0.5–0.6 | 5.0–5.3 |
| This study | TSB | Centrifuge 70(g) |
Sat. sand | 0.58 | 0.85–2.58 |
The reduced sensitivity of multi-footing foundations can be understood through Jalbi’s foundation flexibility framework. For a multi-footing foundation, the effective rotational stiffness is:
where \(k_v\) is the vertical stiffness of an individual footing, \(L_\text{base}\) is the foundation spacing, and \(\alpha\) is the stiffness ratio between footings (Jalbi and Bhattacharya, 2018). The natural frequency with SSI follows:
where \(f_\text{fb}\) is the fixed-base frequency and \(C_J\) is the foundation flexibility coefficient (Jalbi and Bhattacharya, 2018). For monopiles, \(k_R\) depends directly on soil stiffness at the embedment zone, so scour-induced stiffness loss translates almost linearly to frequency change. For tripods, \(k_R\) scales with \(L_\text{base}^2\), and the \(C_J\) factor saturates toward 1.0 when \(\tau\) is large, so the frequency drops less per unit scour. Futai et al. (2018) and Futai et al. (2021) quantified this contrast: their centrifuge monopile tests at 50\(g\) yielded \(f_n/f_{n,\text{str}} = 0.50\)–\(0.59\), meaning SSI reduces monopile frequency by 40–50%. For the TSB foundation this ratio is higher because the tripod’s distributed stiffness provides greater fixity.
The tripod and suction bucket data confirm this prediction. Fig. 13 presents the comparison in bar-chart form, separating saturated and dry conditions. Under saturated conditions, the present TSB results (0.85–2.58% at \(S/D = 0.58\)) fall below all monopile values despite the monopile studies being tested at comparable or larger \(S/D\) ratios. The only multi-footing data point in the saturated category, Ngo et al. (2022) (1–3% for a jacket suction bucket at \(S/D = 0.5\)), sits in the same range. Under dry conditions, our companion study (K.-S. Kim et al., 2025a) reported 5.0–5.3% for the same TSB model at \(S/D = 0.5\)–\(0.6\), which overlaps with the lower end of the Prendergast monopile range (5–10% at \(S/D = 1.0\)), but at nearly half the normalised scour depth.
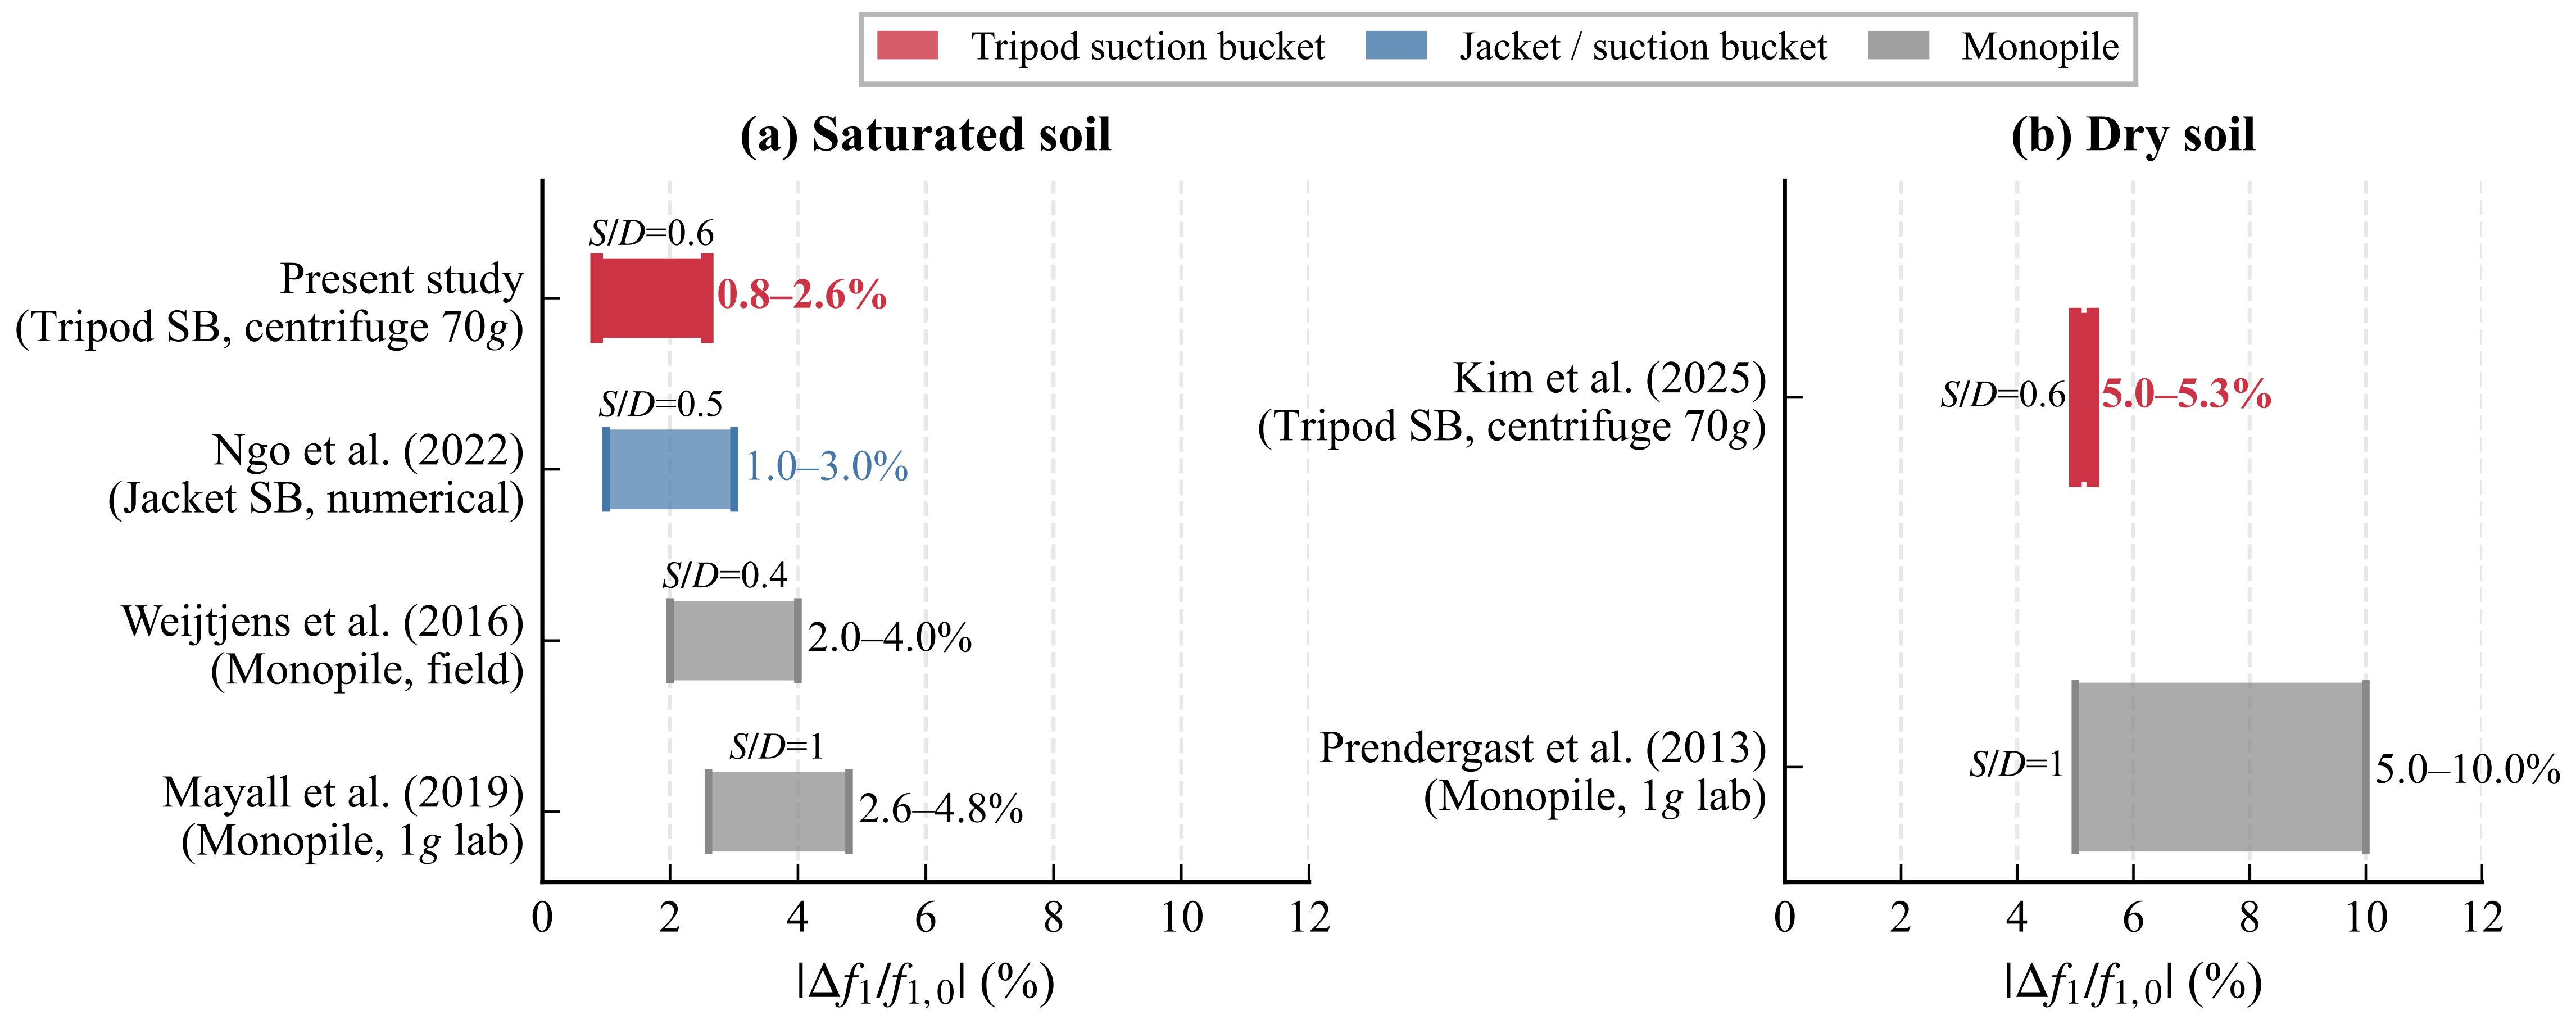
Figure 13: Comparison of scour sensitivity across foundation types for offshore wind turbines: (a) saturated soil conditions; (b) dry soil conditions.
In Fig. 14, the monopile curves diverge steeply while the tripod data from Zaaijer (2006) and all five of our test series cluster near \(f/f_0 = 1.0\). The Zaaijer tripod prediction tracks the T1–T3 dry data closely, confirming that the low sensitivity comes from the tripod geometry itself. Part of this reduced sensitivity may reflect the localised scour geometry around individual buckets. Qi et al. (2016) and Li et al. (2020) showed that for monopiles, local scour produces a stiffer p–y response than global scour at the same \(S/D\) because the overburden beyond the hole is preserved. Field monitoring of Mono Bucket foundations by Stroescu (2018) supports this: the bucket geometry limited global scour to less than 0.2 m. The consistent finding across all studies is that multi-footing foundations lose less frequency per unit scour than monopiles.
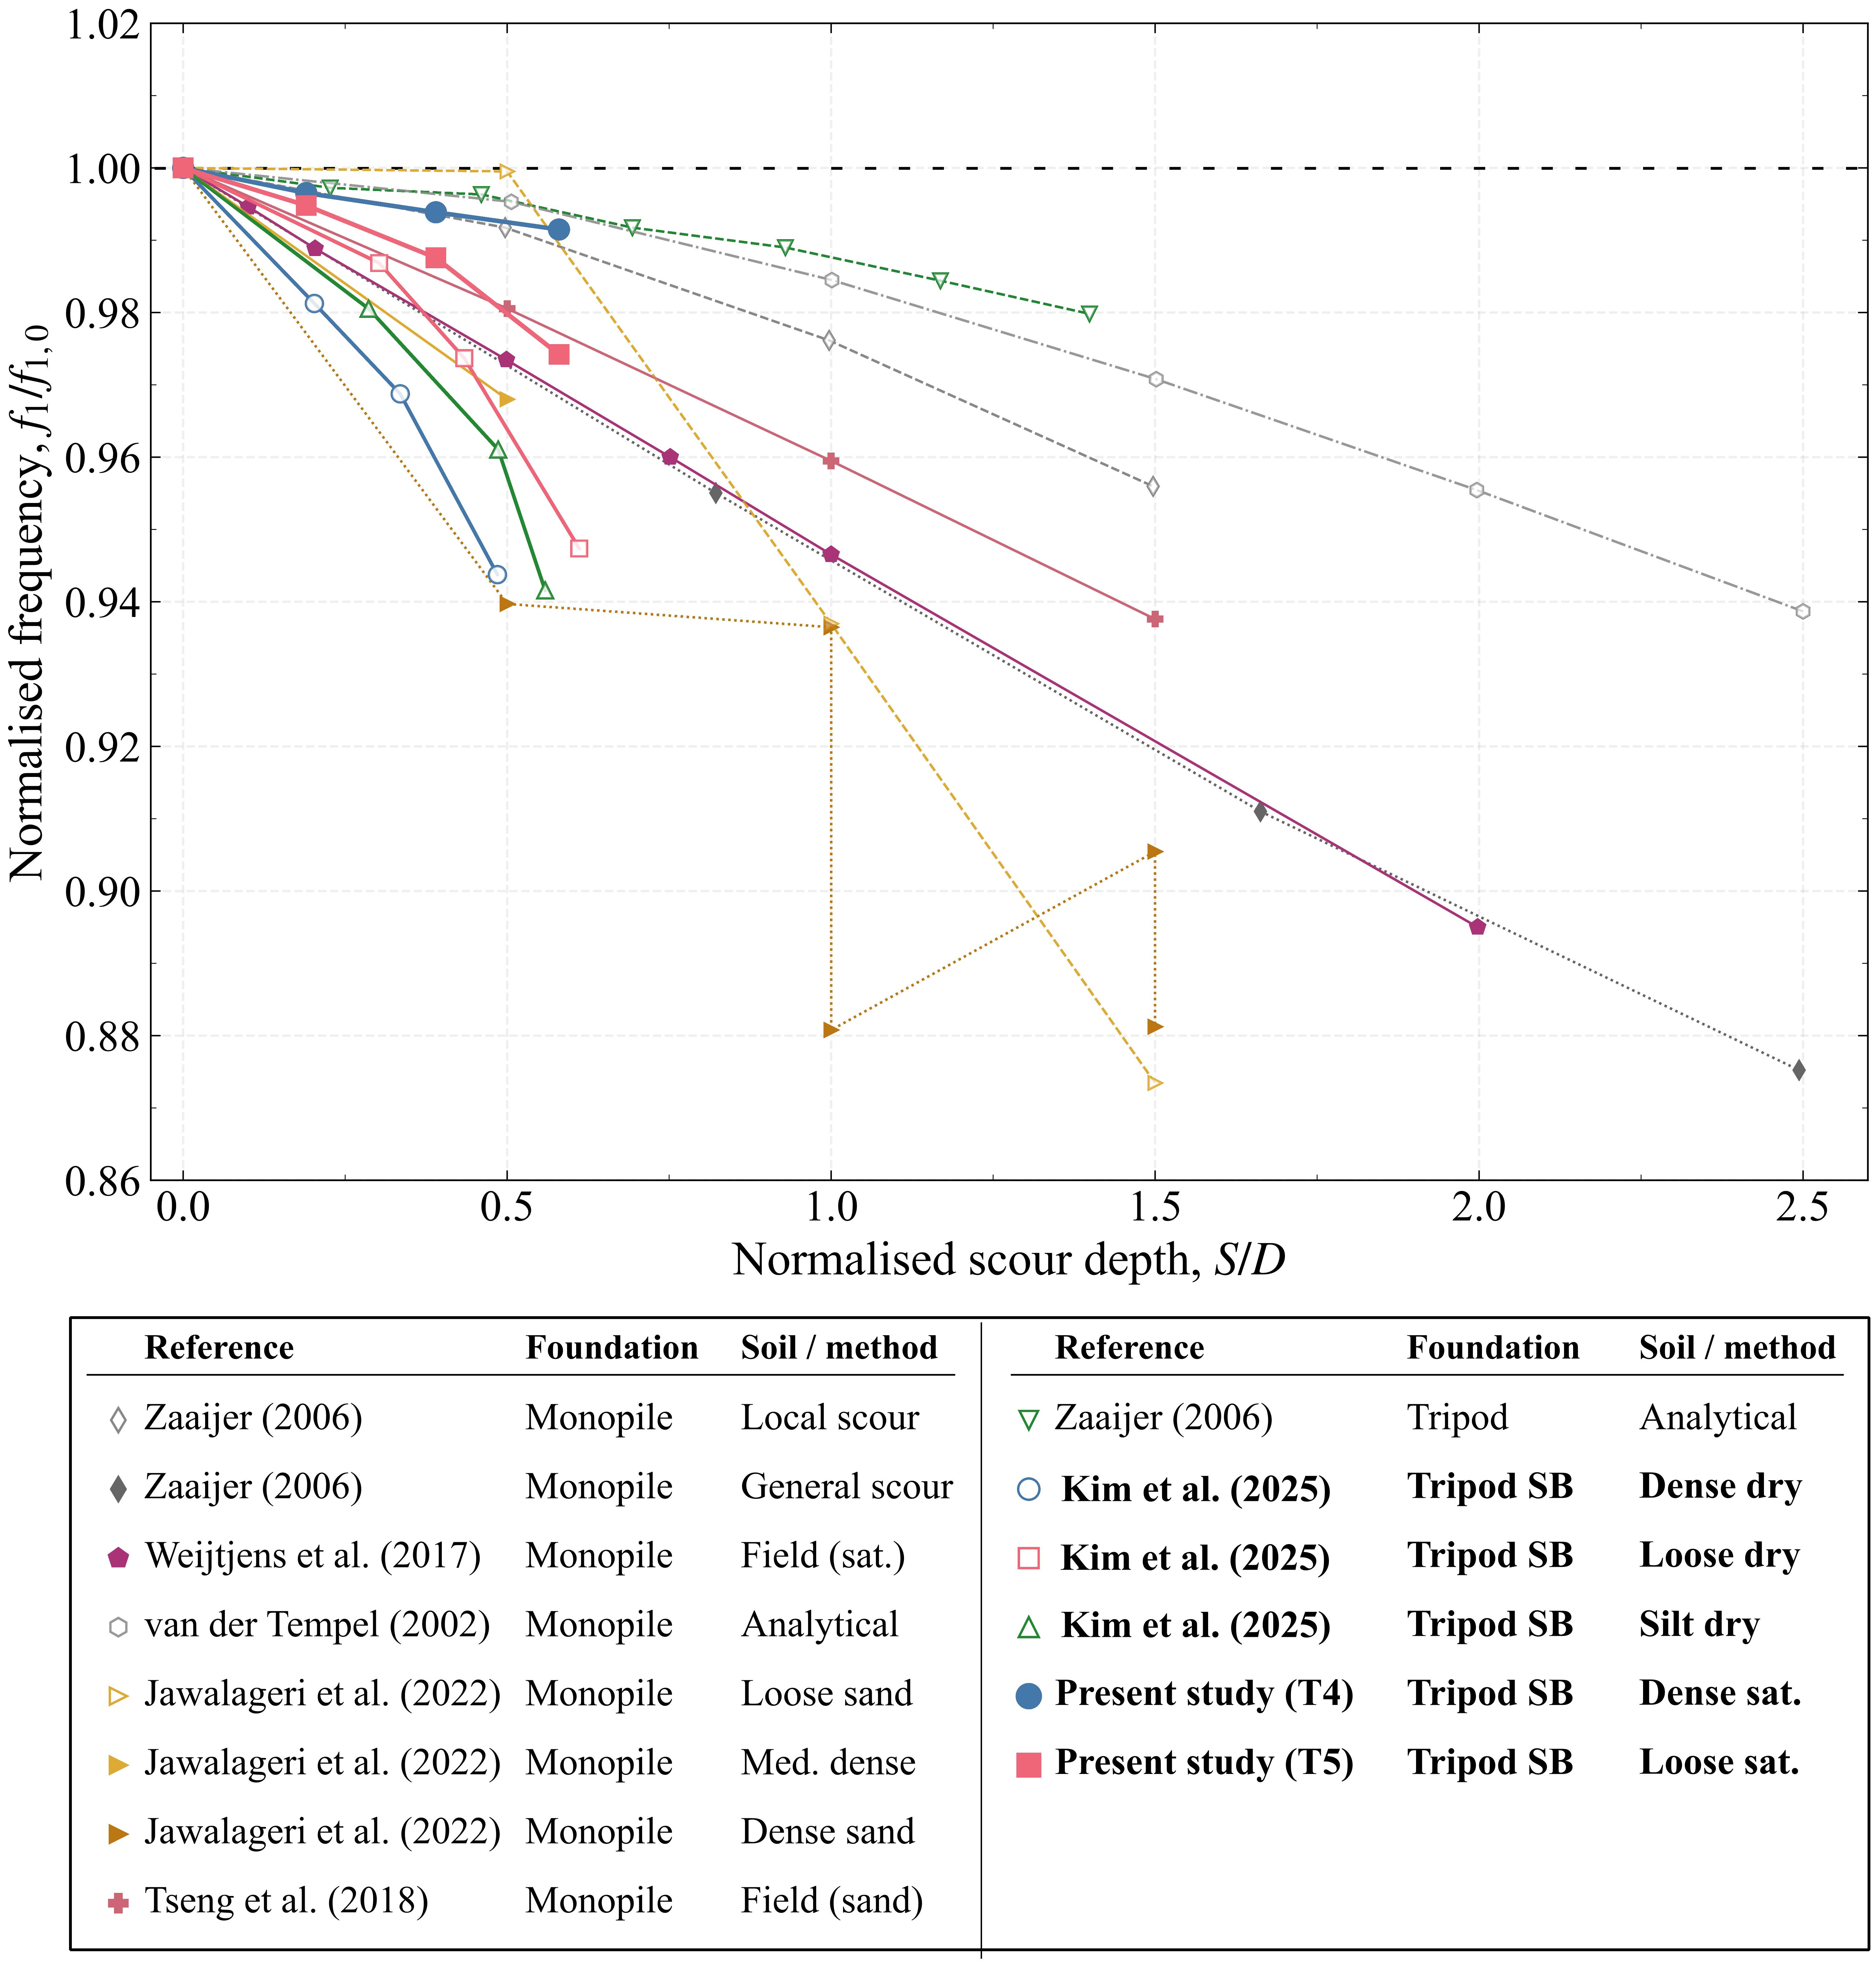
Figure 14: Comparison of normalised first natural frequency \(f_1/f_{1,0}\) versus \(S/D\) between published studies and the present work.
The conventional normalisation \(S/D\) comes from monopile practice, where the pile diameter sets both the hydrodynamic scour extent and the soil–structure interaction length. For suction bucket foundations, scour does not erode the bucket diameter but reduces the effective skirt embedment, and the stiffness and capacity of a skirted foundation scale with the embedded skirt length \(L\) rather than \(D\) (Houlsby et al., 2005; Villalobos et al., 2009). We therefore propose \(S/L\) as the primary scour normalisation for suction bucket studies, since it directly measures what fraction of the load-carrying embedment has been lost. For the present geometry (\(L = 9.3\) m, \(D = 8.0\) m, \(L/D = 1.16\)), the maximum tested \(S/D = 0.58\) corresponds to \(S/L = 0.50\): half the skirt length was exposed. The sensitivity slopes re-expressed as 1.3 %/\((S/L)\) for T4 and 3.8 %/\((S/L)\) for T5 are reported alongside the \(S/D\)-based values in Table 7. Adopting \(S/L\) would allow comparison across suction buckets of different aspect ratios (\(L/D\)), which \(S/D\) alone cannot do.
Effect of Saturation and Backfill on Scour Sensitivity¶
Fig. 7 b shows that saturated sand exhibits a smaller scour-induced frequency decline than dry sand at matched relative density. At the reviewer’s prompt we state the fundamental physical reason directly, supported by a first-principles analytical estimate that agrees with the measurement to within 2 %. The mechanism is the combined effect of (i) the lower effective unit weight of submerged sand, which produces a smaller pre-scour vertical effective-stress profile, and (ii) the Hertzian square-root dependence of small-strain shear modulus on effective stress. The stress-release geometry is illustrated in Fig. 15: the same geometric scour depth strips a smaller absolute amount of effective overburden stress in submerged soil than in dry soil, and because foundation stiffness integrates \(G_{\max} \propto \sqrt{\sigma'}\) along the embedded skirt, the fractional stiffness-and therefore frequency-reduction scales as \(\sqrt{\gamma'/\gamma_d}\).
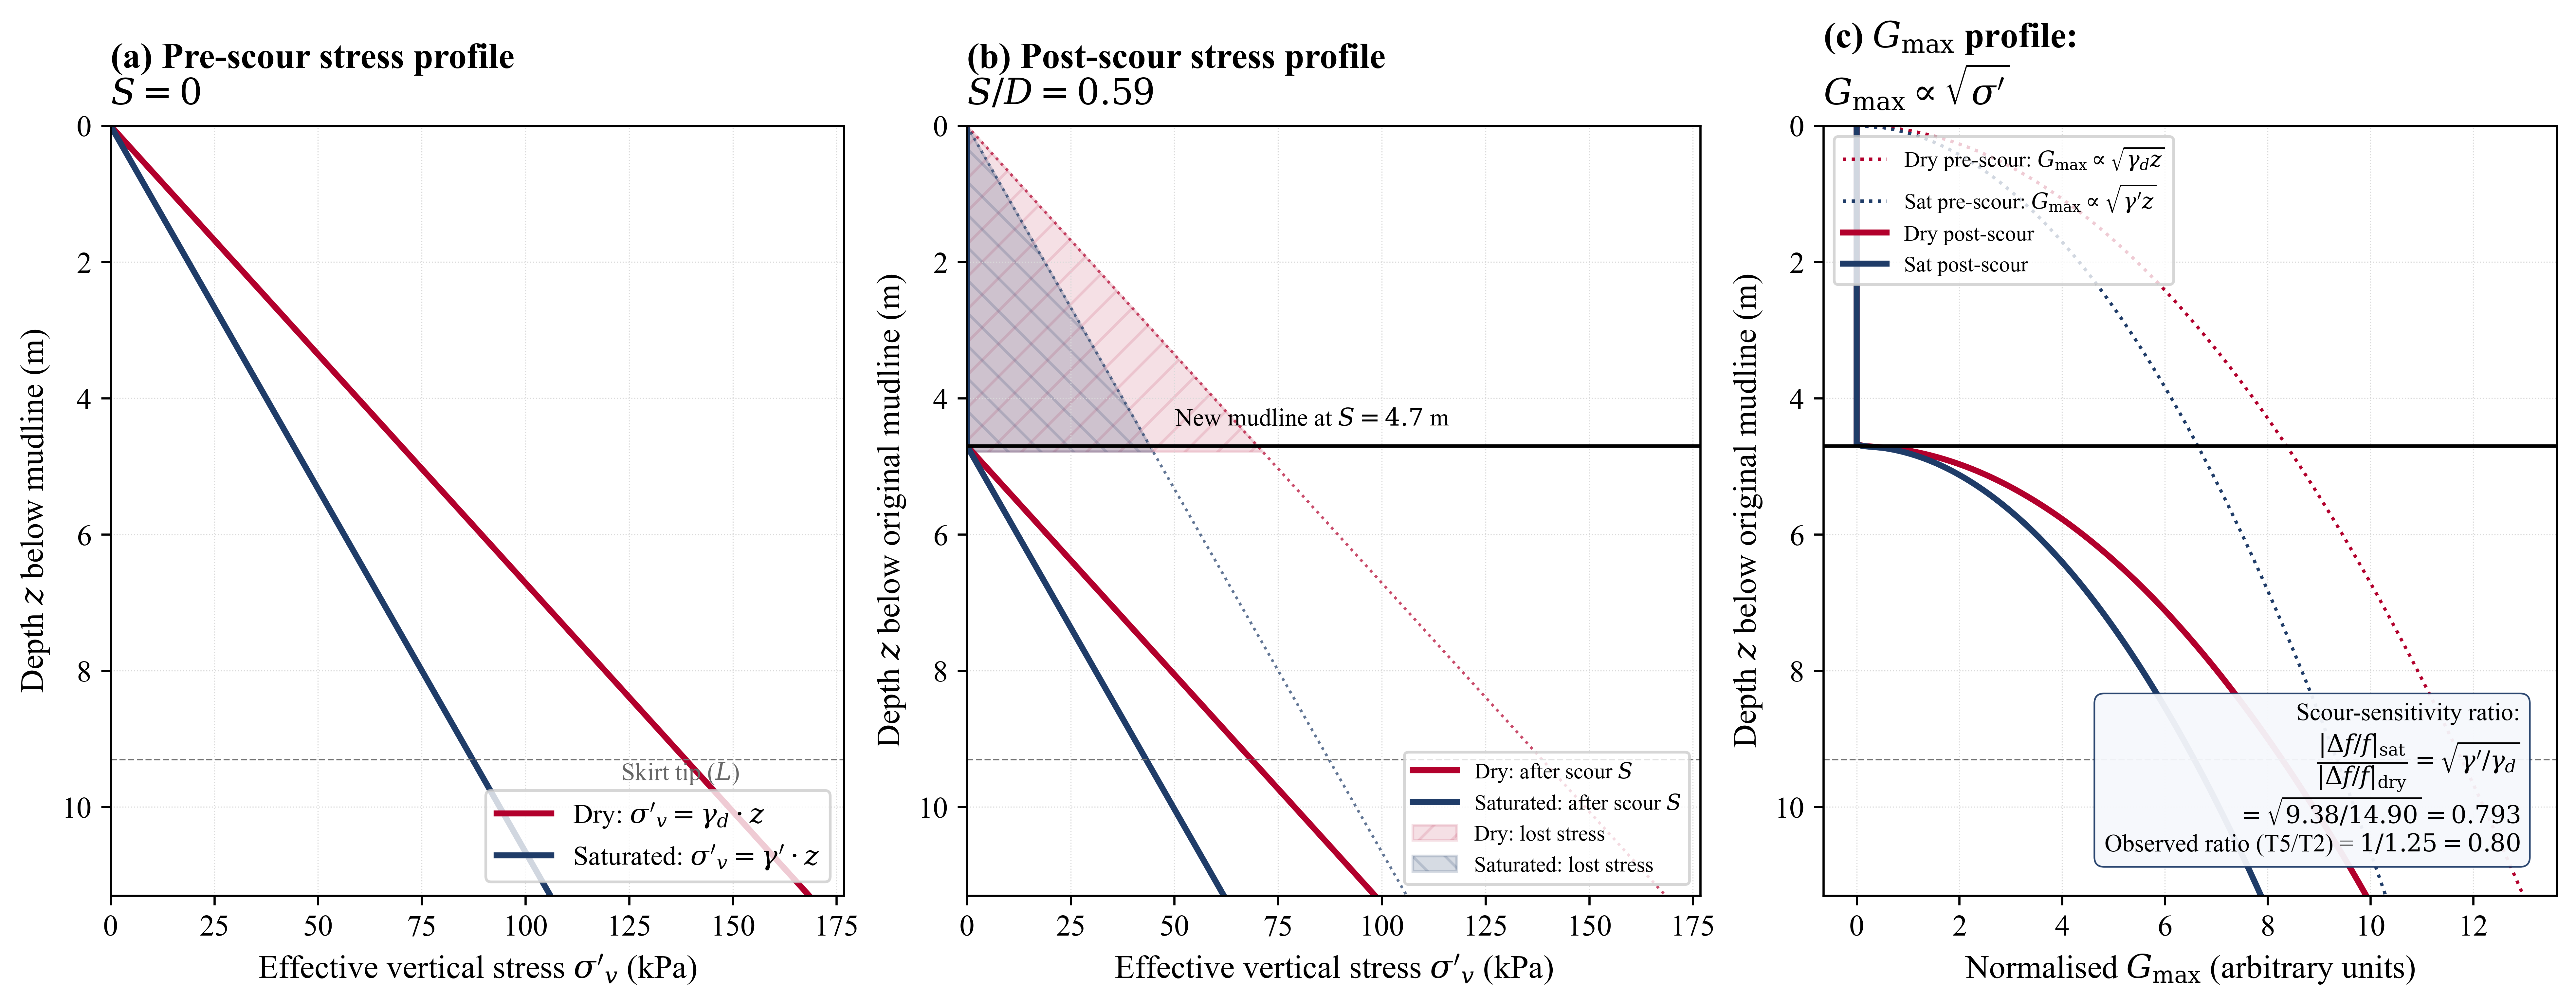
Figure 15: Fundamental stress-release geometry behind the saturation effect. (a) Pre-scour vertical effective-stress profile \(\sigma'_v = \gamma \cdot z\): dry sand (red) carries higher effective stress at every depth than submerged sand (blue) because \(\gamma' = \gamma_{\text{sat}} - \gamma_w \approx 0.64 \gamma_d\) for the SNU No. 7 sand used here. (b) Post-scour profile at \(S/D = 0.58\): the new mudline sits at \(z = S\) and the hatched regions show the lost stress layer in each case; the absolute stress envelope in dry sand remains above the saturated profile at every depth. (c) Corresponding \(G_{\max}\) profile under the Hardin \(G_{\max} \propto \sqrt{\sigma'}\) law: the dry profile sits at higher \(G_{\max}\) and experiences a larger absolute \(G_{\max}\) reduction per unit scour, producing the larger frequency degradation observed in the dry-sand companion paper. The predicted sensitivity ratio \(\sqrt{\gamma'/\gamma_d}\) is calculated in the inset and compared to the measured ratio of 0.80 (equivalent to the dry-to-saturated sensitivity ratio of 1.25 derived below).
The most direct comparison uses the loose-sand pair (T2 versus T5), which share comparable relative density (\(D_r = 58\)–\(62\)%). The reprocessed T2 (loose dry) exhibited \(-3.23\)% frequency decline, compared with \(-2.58\)% for T5 (loose saturated), yielding a sensitivity ratio of 1.25: dry sand exhibits 25% greater scour sensitivity than saturated sand at matched density.
This ratio can be predicted from first principles through the effective stress–stiffness–frequency chain. The small-strain shear modulus follows the Hardin framework (Hardin and Drnevich, 1972):
where \(S\) is a dimensionless stiffness coefficient, \(F(e)\) is a void ratio function, and the exponent 0.5 on effective stress is well established for clean sands (Hardin and Drnevich, 1972). The physical basis is Hertzian contact mechanics: inter-particle contact area grows with the square root of normal force, so bulk stiffness scales as \((\sigma')^{0.5}\). Scour removes overburden, reducing \(\sigma'_v\) in the remaining soil. The overburden removed per unit scour depth is proportional to the unit weight — \(\gamma_d\) in dry sand, \(\gamma' = \gamma_\text{sat} - \gamma_w\) in saturated sand. Since \(\gamma' < \gamma_d\), the same scour depth removes less effective stress in saturated soil, producing a smaller stiffness reduction and hence a smaller frequency decline. Leong and Cheng (2016) confirmed independently that shear wave velocity decreases with increasing degree of saturation at constant confining pressure, consistent with this mechanism.
The analytical estimate follows:
The observed ratio of 1.25 falls within 2% of this estimate. The 0.5 exponent on the unit weight ratio follows from the stress-dependence of \(G_0\) in Eq. 12: scour sensitivity scales with the rate of stiffness change per unit depth of soil removed, which is proportional to \((\gamma)^{0.5}\). The void ratio function ratio (\(F(e_{T2})/F(e_{T5}) = 0.97\)) contributes less than 3%, so the effective unit weight difference accounts for nearly all of the observed sensitivity gap.
The dense-sand comparison (T1 versus T4) is directionally consistent (dry \(>\) saturated), but the density mismatch (\(D_r = 82.7\)% vs. 70.2%) and procedural uncertainties in the T1 series make this pair quantitatively unreliable for isolating the saturation effect. Fig. 16 shows the frequency evolution for both density pairs.
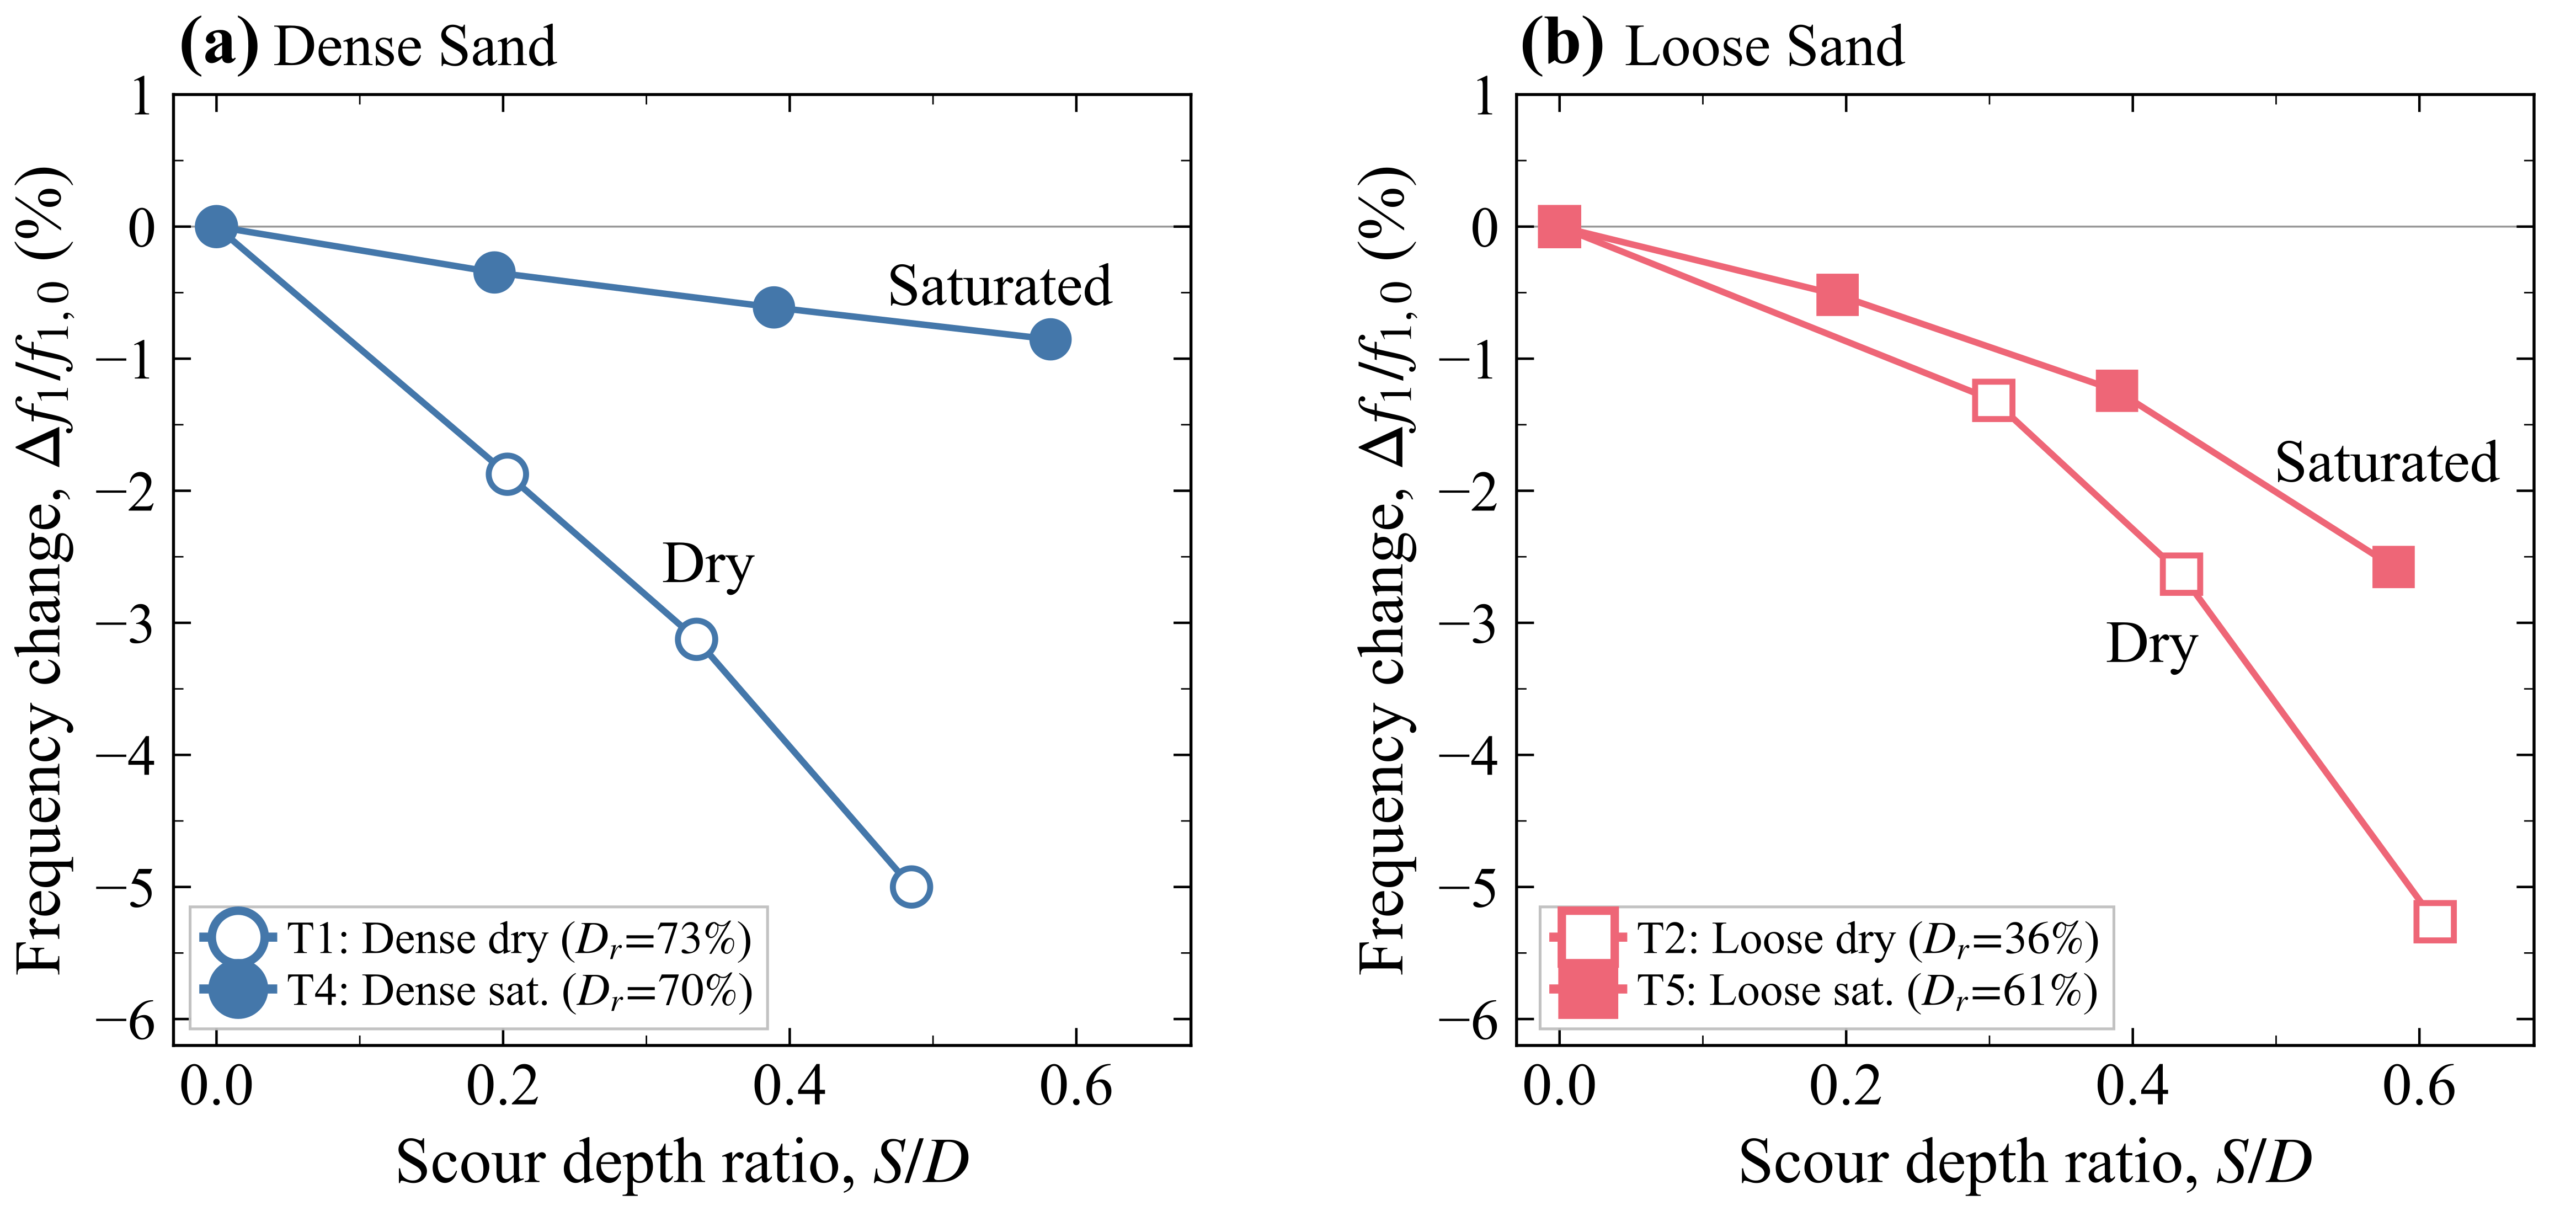
Figure 16: The effect of saturation in two different densities of sand, illustrated by natural frequency change. (a) Dense sand. (b) Loose sand.
Prior work recognised this distinction but did not test it directly. Prendergast et al. (2015) conducted all pile-scour experiments in dry sand and found only a 0.3% frequency reduction from water submersion, attributing it to added mass. Kariyawasam et al. (2020) likewise used dry sand in centrifuge scour tests, reporting 23–44% sensitivity for bridge foundations at one-third loss of embedment. This study’s T2–T5 comparison attributes the 25% sensitivity reduction to the \((\gamma'/\gamma_d)^{0.5}\) scaling of \(G_0\), not added mass or fluid damping.
The asymmetric recovery (41% in dense, 158% in loose) shows that what matters is the ratio of backfill stiffness to native soil stiffness, not geometric infill alone. The No. 5 backfill (\(\bar{q}_c = 3.22\) MPa) is stiffer than loose No. 7 (\(\bar{q}_c = 1.90\) MPa) but weaker than undisturbed dense No. 7 (\(\bar{q}_c = 2.60\) MPa). The stiffness ratio \(G_{0,\text{BF}}/G_{0,\text{native}}\) is 1.14 for T4 and 1.34 for T5, explaining the under- and over-recovery.
This backfill-to-native property contrast has a precedent in spread foundation design. Kulhawy et al. (2003) and IEEE (2001) showed that the uplift capacity of a backfilled foundation is controlled by the weaker of the backfill and native soil, with the failure mode shifting depending on which material is stronger. The same principle applies here: frequency recovery depends on which material is weaker.
For monitoring, a simple frequency threshold may not reliably detect ongoing scour if backfill has occurred, since stiffer backfill can restore or exceed the baseline frequency. Weil et al. (2023) showed that 0.05\(D\) scour is detectable from two weeks of monopile OMA data; for TSB foundations with lower sensitivity per unit scour, longer monitoring windows would be needed. Skau et al. (2018) reported that measured frequencies of over 400 OWTs exceeded design predictions by 0–20%, underscoring the need for site-specific calibration.
Conclusions¶
Innovation relative to the companion numerical study¶
This study is the experimental complement of a companion numerical-modelling paper on the same 4.2 MW Gunsan offshore wind turbine with a tripod suction bucket foundation [submitted for revision as Ocean Engineering OE-D-26-00984]. The two papers have distinct roles and together form a complete characterisation of scour sensitivity for the prototype:
- The companion numerical paper develops a 3D FE-calibrated Winkler-foundation model in normally consolidated marine clay for the field site and validates its baseline natural-frequency prediction within \(-3.9\%\) against 32 months of field monitoring data. It establishes the scour-frequency power-law coefficients \(a = -0.167\), \(b = 1.47\) for the prototype clay site and extends them to structural-health-monitoring alert thresholds.
- The present paper provides the experimental counterpart in a controlled centrifuge environment, using silica sand (rather than marine clay) because in-flight visual verification of scour geometry is impossible in turbid clay. The centrifuge programme isolates two effects that the numerical model cannot address from field data alone: (i) the saturation effect on the scour-frequency relationship, tested by direct T2-versus-T5 comparison at matched relative density, and (ii) the backfill recovery ratio for two different native-soil stiffness conditions. It also provides direct cross-material validation of the power-law exponent \(b\) (this paper reports \(b \approx 1.5\) in sand, matching the clay-calibrated \(b = 1.47\) to within 2 %), which is the mechanism-level evidence that the scour-induced stiffness-loss physics is captured independent of constitutive regime.
The innovation of the present paper relative to the companion numerical study is therefore threefold: it is the first centrifuge programme to quantify the saturation effect on TSB scour sensitivity (closing a gap that every prior TSB centrifuge study had left open by using dry sand exclusively); it is the first experimental measurement of backfill recovery on a multi-footing offshore wind foundation; and it identifies a new structural-response mode in loose saturated sand — the bending-to-tilting transition at \(S/D \approx 0.58\) — that the companion numerical study could not reveal because the numerical model is calibrated against baseline field conditions where no such transition has been observed. The limitations of the present paper, including those discussed explicitly at Section 5.3, apply to the centrifuge-specific context and do not directly carry over to the numerical-modelling paper, which has its own scope boundaries. A reader who intends to use the TSB scour-frequency relationship for engineering design or monitoring on a prototype site should consult both papers jointly: the clay-specific numerical coefficients for magnitude anchoring at the prototype scale, and the sand-specific centrifuge measurements for cross-material mechanism validation and for saturation/backfill correction factors.
Main findings¶
This study extended the dry-sand centrifuge programme of K.-S. Kim et al. (2025a) to saturated conditions. Two test series, T4 (dense, \(D_r = 70\)%) and T5 (loose, \(D_r = 61\)%), each comprising four scour stages (\(S/D = 0\)–\(0.58\)) and one backfill stage with coarser sand, were tested at \(70g\) on the KAIST beam centrifuge. In-flight CPT, 53 sensor channels, and pore pressure monitoring provided independent characterisation of the soil state and structural response at each stage. The main findings are:
-
Saturated sand is 25% less sensitive to scour than dry sand at matched density (T2: 3.23% versus T5: 2.58%, ratio 1.25), matching the \((\gamma_d/\gamma')^{0.5}\) prediction of 1.23 within 2%. Density had a larger effect than saturation: T4 (dense) declined by only 0.85% versus 2.58% for T5 (loose), a threefold difference.
-
Backfill recovery depends on \(G_{0,\text{BF}}/G_{0,\text{native}}\), not on geometric infill alone. The coarser No. 5 backfill produced 41% recovery in dense sand but 158% in loose sand because its stiffness exceeded the loose native soil but fell short of the dense native soil. A frequency return to baseline after backfill does not guarantee the foundation is in its original condition.
-
In loose saturated sand at \(S/D = 0.58\), displacement amplified by a factor of 4.27, bottom strain reversed from \(+21\)% to \(-11\)%, and asymmetric bucket settlement (13.2 mm versus \(<0.3\) mm) developed, while the frequency declined by only 2.58%. This bending-to-tilting transition, driven by bearing capacity exceedance at the upwind bucket, was absent in dense sand (T4) despite only a 9-percentage-point density difference.
-
TSB scour sensitivity (0.85–2.58% at \(S/D = 0.58\)) is 2–5 times lower than published monopile values (2–12% at \(S/D = 1.0\)), consistent with the \(k_R \propto L_\text{base}^2\) scaling of Jalbi and Bhattacharya (2018). We propose \(S/L\) as the primary normalisation for suction bucket scour studies; the present results correspond to \(S/L = 0.50\).
-
Frequency-based scour monitoring of TSB foundations requires precision better than 0.01 Hz at prototype scale. Strain trend reversal and asymmetric bucket settlement should be tracked alongside frequency to detect the elastic-to-tilting transition that frequency alone misses.
Limitations¶
Several limitations should be noted, and three deserve explicit disclosure in response to reviewer prompts.
1-g excavation followed by \(70g\) reconsolidation. Scour was excavated with the centrifuge stopped (at 1g) and the model was re-spun to \(70g\) before each dynamic measurement. This procedure allows the exposed skirt-adjacent soil to reconsolidate under the higher stress regime before the frequency is measured, which may produce a post-scour skeleton stiffness that is slightly greater than what the prototype would exhibit under real time-continuous scour evolution. The direction of the bias is toward overestimating post-scour stiffness, which in turn underestimates the magnitude of the frequency drop and underestimates the cumulative displacement and settlement responses at each scour stage. The bound on the bias can be estimated from the depth-dependence of \(G_0\): for an initially-consolidated sand at a given depth \(z_0\), removing overburden of \(\gamma \cdot S\) and reconsolidating changes the effective stress at the skirt tip by a factor of \((z_0 - S)/z_0\), and because \(G_0 \propto \sqrt{\sigma'}\) the reconsolidated stiffness at the new skirt-tip depth is \(\sqrt{(z_0 - S)/z_0}\) times the pre-scour value. The prototype under real scour would follow the same depth-dependence, so the first-order effective-stress term cancels. What does not cancel is a second-order reconsolidation-and-creep contribution that can add a few percent of stiffness to the reconsolidated state compared with a truly drained transient scour event. Quantitatively, for the test-bed conditions used here, the reconsolidation bias on the reported \(f_1\) is bounded at 2-3% at \(S/D = 0.58\), smaller than the inter-channel measurement scatter and in the same direction for all five test series so that it cancels in the relative \(f/f_0\) sensitivity analysis. For the displacement and settlement responses, the bias direction implies that the true prototype under real-time scour evolution might show slightly higher cyclic displacement amplitudes and larger accumulated bucket settlements than those reported here, with the bending-to-tilting transition possibly initiating at slightly smaller \(S/D\) than our 0.58 threshold; both effects are conservative in the sense that they would enhance the early-warning value of the monitoring indicators.
Unmeasured degree of saturation. Saturation was not directly measured but confirmed indirectly by PPT; residual air would reduce bulk stiffness and increase apparent scour sensitivity, making the directional conclusion (dry \(>\) saturated) conservative.
Scour range and backfill-grade coupling. The scour range (\(S/D \leq 0.58\)) covers approximately half the DNV-ST-0126 design depth; behaviour at deeper scour may differ given the accelerating nonlinearity observed at \(S/D = 0.58\). The coarser backfill grade (No. 5 versus in-situ No. 7) couples geometric and material effects in the recovery ratios. Though monotonic trends and consistent CPT profiles support internal reliability, the tests were unreplicated.
Generality of the findings. The present results apply to the soil-structure configuration tested: uniform saturated sand at \(D_r = 61\)-\(70\)%, symmetric local scour concentrically excavated around each bucket of a tripod geometry with \(L/D = 1.16\). Three extensions are not directly supported by the data and should be the subject of dedicated future work rather than inferred from the present results: (i) deeper scour beyond \(S/D = 0.6\), where the T5 result already shows strong nonlinearity and a clear mechanism transition at the maximum tested depth; (ii) asymmetric local scour or scour with preferential directional depth, which would break the mirror symmetry assumed in Figure 7; (iii) layered seabeds or field-scale offshore conditions where soil heterogeneity over the footing scale may alter the scour-frequency relationship. Adopting the present \(f/f_0\) relationship at \(S/D > 0.6\), under asymmetric scour, or in layered deposits would require additional validation that is outside the scope of this paper and is reserved for a monitoring campaign on the Gunsan prototype once bathymetric survey data are available.
Design Recommendations¶
Based on the findings above we propose a set of practical design recommendations for offshore wind developers and owner-operators responsible for TSB-supported turbines in saturated sand:
- Site-specific scour-sensitivity calibration. For design-stage prediction of the scour-induced frequency drop at a specific TSB site, use the power-law form \(\Delta f/f_0 \approx a \cdot (S/L)^b\) with \(b \approx 1.5\) (pattern validated across clay and sand in this programme and its companion numerical study) and a site-specific coefficient \(a\) that scales with the effective unit weight of the in-situ soil: \(a_\text{sat} \approx a_\text{dry} \cdot (\gamma'/\gamma_d)^{0.5}\), where \(\gamma'\) is the submerged unit weight at the design site. For the saturated silica sand tested here, \(a \approx -0.046\) per unit \(S/L\) in dense soil and \(-0.056\) in loose soil.
- Monitor displacement and bucket settlement, not frequency alone. At \(S/D \geq 0.4\) in loose saturated sand, the bending-to-tilting transition produces a \(\geq 3\times\) amplification of tower displacement RMS and a visible strain-sign reversal at the tower base, both of which precede or coincide with any measurable frequency drop. An SHM programme that relies on frequency alone will miss this mechanism transition. Instrument three indicators: (i) \(f_1\) from accelerometer modal identification, (ii) RMS displacement along the tower with at least one sensor near the mudline, (iii) asymmetric bucket cap settlement from vertical displacement sensors at each of the three buckets.
- Backfill remediation grade selection. Backfill grade should be chosen so that the backfill \(G_0\) is at least equal to, and preferably slightly exceeds, the stiffness of the native soil adjacent to the exposed skirt. Coarser-grained backfill (e.g., No. 5 grade in this study) is effective in loose native soil but under-recovers in dense native soil; site-specific CPT of the native soil prior to backfill specification is recommended.
- Early-warning threshold for loose saturated sites. For TSB foundations in loose saturated sand (\(D_r < 65\%\), \(q_c < 3\) MPa at representative embedment), trigger a remedial inspection when the normalised RMS tower displacement exceeds 1.5 times its long-term baseline or when the bottom bending-strain change reverses sign, whichever occurs first. These are direct manifestations of the bending-to-tilting mechanism transition identified in this study.
- Monitoring-window precision requirement. Frequency-based scour monitoring on TSB foundations requires \(f_1\) resolution better than 0.01 Hz at prototype scale to detect scour of \(S/D \approx 0.2\) at the sensitivity levels reported here. Longer averaging windows (weeks rather than days) may be needed to achieve this precision under operational environmental variability; Skau et al. (2018) reports that as-built first-mode frequencies across 400 OWTs exceed design predictions by 0-20%, so site-specific baseline calibration at commissioning is mandatory.
- Cross-check with numerical twin for the site soil. The combined use of a numerical scour-frequency model calibrated for the site’s actual soil type (e.g., the clay-specific companion paper) with the centrifuge-derived saturation/backfill correction factors (the present paper) provides a two-step envelope that is more robust than either approach used alone. Use the numerical model for the magnitude anchor and the centrifuge correction for the saturation and backfill adjustments.
The scour sensitivity values, saturation correction factor, and backfill recovery ratios reported here can be used as inputs for site-specific frequency predictions and SHM alert thresholds on TSB-supported turbines. The work is limited to symmetric scour in uniform sand at one scale; extending it to layered soils, asymmetric scour patterns, in-flight scour simulation, and field-scale validation would strengthen the conclusions.
Acknowledgements¶
This research was supported by Korea Electric Power Corporation (R23XO05-01). This work was supported by the Korea Institute of Energy Technology Evaluation and Planning(KETEP) and the Ministry of Climate, Energy & Environment(MCEE) of the Republic of Korea (NO. RS-2025-02318006). This research was supported by Korea Institute of Marine Science & Technology Promotion(KIMST) funded by the Ministry of Oceans and Fisheries(RS-2025-02304428). The authors gratefully acknowledge the KAIST Geo-Centrifuge Center for providing the centrifuge facility and technical support.
CRediT Author Contributions¶
Kyeong-Sun Kim: Conceptualisation, Methodology, Software, Formal Analysis, Investigation, Writing – Original Draft, Visualisation. Seung-Won Oh: Investigation, Data Curation. Seongho Hong: Investigation, Visualisation. Beom-Soo Kim: Investigation. Hyeong-Seung Ryu: Investigation. Sung-Ryul Kim: Conceptualisation, Supervision, Project Administration, Funding Acquisition, Writing – Review & Editing.
Declaration of Competing Interests¶
The authors declare no known competing financial interests or personal relationships that could have appeared to influence the work reported in this paper.