Author's accepted manuscript
This page is the author's accepted manuscript (AAM) of a paper under peer review at Ocean Engineering (manuscript ref. OE-D-26-00984R1). Status: Round 2 response due 2026-04-29. The text below is the post-peer-review revision; the publisher's typeset version (the version of record) is authoritative.
Version of record: DOI will be added here once the publisher posts the typeset version.
Shared under CC BY-NC-ND 4.0, in accordance with the publisher's author-sharing policy.
Summary
Full title
Scour-Induced Natural Frequency Degradation of Offshore Wind Turbine Tripod Bucket Foundations Using a 3D FE-Calibrated Winkler Model.
One-sentence headline
A three-phase computational pipeline — 3D limit-analysis reference → Fourier-decomposed spring extraction → 1D BNWF eigenvalue analysis — predicts the baseline natural frequency of the Gunsan 4.2 MW tripod within −3.9 % of field measurements, establishes a power-law \(|\Delta f / f_0| = 0.167 (S/D)^{1.47}\) across 11 scour depths, and delivers a five-order-of-magnitude speed-up over direct 3D analysis.
Context
Monopile-derived design tools treat the foundation as a single embedded column. Industry standards prescribe p-y curves from slender piles with \(L/D > 10\) — an assumption that fails for tripod buckets operating at \(L/D \approx 1\), where lid bearing, skirt friction, and passive wedge mobilisation jointly govern response. The PISA project solved this for monopiles through instrumented testing and 3D FE calibration; no equivalent existed for suction bucket geometries, let alone for tripods where three buckets interact through a shared superstructure.
Research question
Can a 3D-FE-calibrated 1D Winkler model reproduce the scour-induced frequency degradation of a tripod suction bucket foundation with accuracy sufficient to replace full 3D analysis in design practice, while preserving depth-resolved soil–structure interaction physics and supporting scour-depth inference from routine accelerometer data?
Approach
Three sequential phases: (1) OptumGX 3D limit analysis extracts lateral reaction profiles at 11 scour depths on the Gunsan geometry; (2) a Fourier mode decomposition of the 3D reactions maps them to nonlinear spring stiffness and capacity profiles; (3) OpenSeesPy runs a beam-on-nonlinear-Winkler-foundation eigenvalue analysis. The whole pipeline runs in under a minute per scour state on a laptop.
Gap the paper closes
- Defensive. No published Winkler model has been calibrated against 3D FE for the scour-frequency relationship of tripod suction bucket foundations.
- Offensive. Scour-stiffness literature treats foundations as isolated columns; tripods redistribute through three footings, and monopile-derived Winkler models are fundamentally wrong for this geometry.
- Constructive. Provides the PL-1 power-law coefficients that V, A, and Op3 consume for real-time monitoring thresholds and digital-twin updating.
Key literature anchors
- Arany et al. (2015, 2016) — three-spring closed-form OWT frequency with <3.5 % error across 10 wind farms.
- Jalbi & Bhattacharya (2018) — multi-footing frequency sensitivity ~5× lower than monopile.
- Beuckelaers (2017, PISA) — 3D-FE calibration of soil reaction curves for large-diameter monopiles.
- Suryasentana (2018) — OxCaisson Winkler surrogates for suction caissons.
- Stuyts et al. (2022, 2023) — monitored frequencies systematically 5–15 % above design predictions.
Headline findings
- Baseline prediction matches 32-month field data within −3.9 %.
- Scour-frequency relation: \(|\Delta f / f_0| = 0.167 (S/D)^{1.47}\) for \(0 \le S/D \le 0.6\).
- ~10⁵× speed-up over direct 3D continuum reanalysis at each scour state.
- Mode C (distributed BNWF) reproduces Mode A (full 3D) reactions within 5 % across the tested depth range.
- Power-law exponent \(b = 1.47\) lies between pile-like linear response and bearing-failure square-law response — a distinct signature of tripod hybrid mechanics.
Limitations
- Circumferentially uniform scour only — asymmetric scour left for future work.
- Tresca undrained total-stress constitutive model fits Gunsan marine clay; layered deposits and stiffer small-strain regimes require re-calibration.
- The 3.0× scaling factor from FE-extracted stiffness to small-strain dynamic stiffness is justified by the literature (Hardin-Drnevich 1972, Benz 2007) but a dedicated sensitivity study is an R2 work item.
Portfolio flow
- Consumes: J11 theoretical spring shape; J1 / J3 centrifuge validation data.
- Produces: PL-1 power-law coefficients → V, A, Op3; calibrated Winkler springs → J5 Monte Carlo ensemble.
Status
Under revision (R2). Response due 2026-04-29. See Reviews / J2 for the point-by-point tracker across 17 reviewer comments from three reviewers.
Introduction
The natural frequency of offshore wind turbines must remain within narrow operational bounds to prevent resonance with rotor harmonics and blade-passing frequencies (Fig. 1). For 4–5 MW turbines, this acceptable range typically spans \(0.22\)–\(0.35\)~Hz, positioned between the one-per-revolution (1P) rotor frequency and the three-per-revolution (3P) blade-passing frequency. Deviations as small as 3–5% from design values can significantly amplify fatigue damage [1]. Scour can shift the tower’s natural frequency into the 1P-3P rotor excitation range, potentially increasing the risk if left unmitigated [2]. Foundation stiffness and its degradation under scour directly control this natural frequency, making accurate soil-structure interaction modeling essential for predicting remaining useful life.
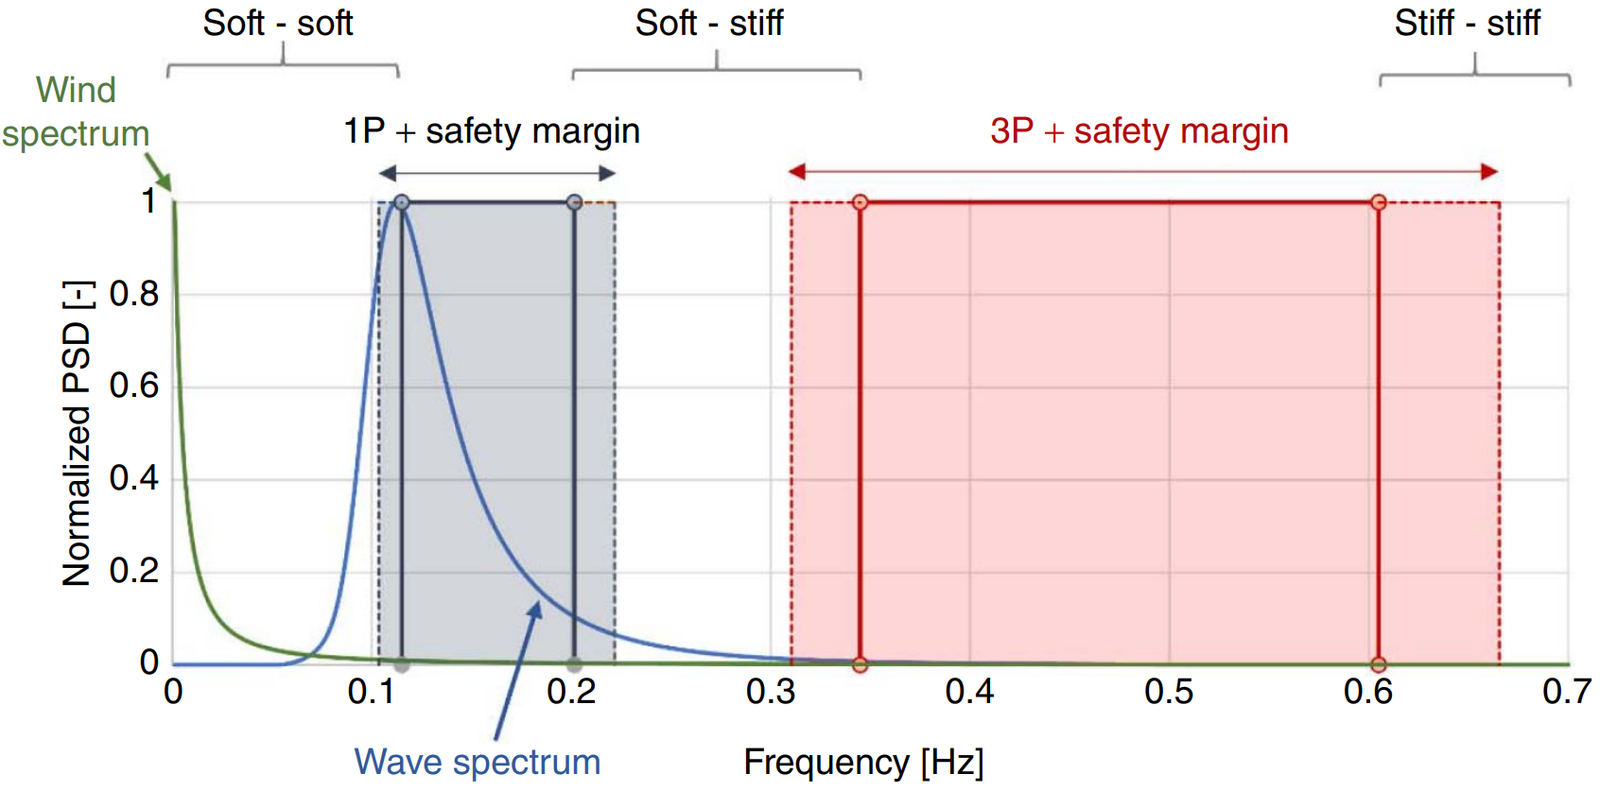
Figure 1: Natural frequency constraints for offshore wind turbine design: the soft-stiff design region between 1P rotor frequency and 3P blade-passing frequency, shown relative to wind and wave excitation spectra. Scour-induced frequency reduction can shift the system toward the 1P boundary, increasing resonance risk.
Offshore wind turbines face an additional challenge absent from onshore structures: progressive scour systematically degrades foundation support throughout their lifecycle. Numerical models calibrated to field measurements can enable condition-based maintenance [3, 4], but their deployment is limited by practical obstacles. Three-dimensional finite element analyses capture the complex stress redistribution within suction bucket foundations, yet these computations typically require hours to complete. Operational monitoring in the field demands predictions at intervals of minutes to hours. This order-of-magnitude gap in computational timescales prevents direct coupling between geotechnical modeling for foundation analysis and real-time monitoring in the field.
As a consequence, sensors such as accelerometers and strain gauges continuously generate measurement data, but the geotechnical numerical models needed to interpret that data cannot synchronize. A detailed 3D analysis computations finishing after time gap reflects real-world conditions that have already changed. Therefore, most engineers and practitioners resort to pre-computed lookup tables or empirical correlations, despite the fact that these approaches sacrifice the governing physics and thus accuracy.
The challenge is particularly acute for suction bucket foundations, which exhibit fundamentally different load-transfer mechanisms than the slender piles for which most empirical methods were developed. Bucket foundations feature aspect ratios (length-to-diameter, \(L/D\)) typically between 0.5 and 1.5, an order of magnitude lower than offshore piles where \(L/D\) typically exceeds 10. This geometric distinction produces qualitatively different behavior. The resistance of suction bucket foundation is derived from a complex hybrid mechanism combining lid bearing, skirt friction, and passive wedge mobilization, whereas pile resistance is primarily dominated by distributed shaft friction with end bearing as a secondary contribution. Recent full-scale field testing has confirmed these physical differences [5], while analytical solutions for tripod suction bucket foundations have demonstrated unique load-sharing characteristics among bucket groups [6, 7].
Traditionally, the offshore industry’s standard practice for soil-structure interaction modeling relies on empirical p-y curves codified in API RP 2GEO [8] and DNV-RP-C212 [9]. These relationships, however, are derived from instrumented pile tests conducted in the 1970s and 1980s, relate lateral soil resistance to pile deflection through semi-empirical backbone curves calibrated for slender, flexible piles in soft clay and sand. For tripod suction bucket foundations, these empirical curves are inadequate for several reasons rooted in the fundamental differences in their mechanics. The API and DNV formulations assume distributed resistance along a slender member where local soil failure occurs independently at each depth, whereas bucket foundations mobilize global failure wedges in which lid and skirt resistances are kinematically coupled through three-dimensional failure mechanisms rather than a series of two-dimensional slices. The empirical curves also derive initial stiffness from pile flexibility considerations, but rigid bucket behavior produces substantially higher initial stiffness governed by the small-strain shear modulus, which empirical correlations systematically underestimate. The ultimate lateral capacity in API curves scales linearly with depth for soft clay, yet suction bucket foundations exhibit nonlinear depth-dependency governed by a power-law relationship, substantially different from the implicit linear assumption in API formulations. Recent centrifuge studies confirm these deficiencies: systematic overprediction of monopile deflections occurs when API curves are applied without modification [10], while suction caisson behavior requires explicit treatment of the lid-skirt interaction mechanism [11].
To resolve this, contemporary geotechnical practices typically employ 3D finite element methods to capture the complex soil-structure interaction mechanisms, trying to capture accurate response of suction bucket foundations. Commercial FEM softwares such as OptumGX, Plaxis 3D, and ABAQUS resolve continuum mechanics with high fidelity [12, 13], while structural dynamics analyses utilize 1D beam-column formulations in BLADED, SAP2000, SACS, and OpenSees where computational efficiency enables thousands of load case evaluations [14]. This creates an inescapable scale and dimensional incompatibility: 3D finite element analysis yields spatially distributed stress and displacement fields comprising millions of degrees of freedom for geotechnical analysis, while 1D models require discrete spring stiffnesses at tens of nodal locations for structural analysis.
Matching a single field measurement does not guarantee reliable predictive capability. A model may achieve low baseline error through parameter calibration or through compensating errors that happen to cancel. For example, infinite foundation stiffness (fixed-base assumption) overpredicts natural frequency, while simplified tower representation underpredicts it. For certain configurations, these biases may cancel out and the prediction appears to be accurate. However, this does not guarantee real physical response. It holds only within the calibrated boundary regime and provides no mechanism for tracking how properties evolve with time as degradation (e.g., scour and corrosion) naturally progresses. The practical value of a numerical model for field monitoring lies not in matching today’s measurement, but in predicting tomorrow’s fundamental property (i.e. natural frequency) after the foundation has degraded or the soil has aged. That predictive capability demands explicit treatment of soil-structure interaction through consistent parameter mapping from 3D to 1D representations.
Previous researchers have pursued several strategies to bridge this gap between 3D geotechnical analysis and 1D structural dynamics with diverse foundation modeling approaches. The simplest approach assumes infinite foundation stiffness with the foundation structure fixed at the mudline. By construction, however, such models predict identical frequency regardless of scour state. Macro-Element formulations [15–17] condense foundation response into coupled force-displacement relationships at a single reference node with 6x6 stiffness matrix, but this sacrifices the depth-varying stiffness distribution governing modal response of a real structure. Page et al. (2019) [18] reported that Macro-Element predictions can deviate notably from 3D finite element results for natural frequency. Furthermore, Macro-Element models cannot accurately capture how depth-dependent foundation stiffness evolves as scour depth increases. Also, empirical p-y curves [8, 19] were developed for slender piles and inadequately capture lid resistance and plug mobilization in suction bucket foundations. Other methods such as data-driven surrogate models [20] sidestep the physics by interpolating foundation response from training databases. Neural networks can be computationally efficient, but they lack interpretability and cannot guarantee reliable extrapolation beyond training conditions. Furthermore, closed-form analytical solutions [6, 21, 22] enable rapid estimation under simplifying assumptions—elastic half-space, homogeneous soil—that poorly represent the stratified marine deposits encountered at most offshore sites especially in Yellow Sea.
This paper introduces a framework for automated extraction of 1D Winkler spring parameters from 3D finite element results while ensuring energy consistency through established mechanics principles, using approach similar to beam on a nonlinear Winkler foundation (BNWF). The methodology implements three key components. First, 3D finite element simulations utilizing load-deformation analysis and limit analysis in OptumGX are carried out across eleven scour depths. Second, integrated soil reaction data from 3D simulations are meticulously analyzed, fitting a power-law relationship through robust regression on plate-soil contact pressure for depth-dependent stiffness profile. Then, stiffness-capacity calibration constrains local spring capacities to global failure envelopes determined through limit analysis in OptumGX, ensuring the 1D model satisfies the integral energy constraint with the parent 3D continuum. Third, 1D structural model is constructed using OpenSees with various foundation models such as fixed-base, Macro-Element, BNWF, and distributed BNWF models. The stress-corrected spring formulation then adjusts stiffness and capacity based on effective stress changes as scour modifies the overburden pressure. The framework was validated at two scales: centrifuge model tests conducted with equivalent reference model at 70g established fundamental validation for scour-sensitive natural frequency degradation under controlled laboratory conditions, while field measurement for natural frequency of the referenced 4.2 MW Gunsan offshore wind turbine demonstrated predictive capability against operational monitoring data.
Numerical Framework
Computational Workflow
The proposed framework addresses the 3D-to-1D translation through three consecutive computational phases. The workflow diagram (Fig. 2) shows the data flow between computational phases. Stiffness extraction and capacity calibration are treated separately because they reflect different soil response regimes: stiffness derives from small-displacement behavior where the soil remains quasi-linear, while capacity requires limit analysis that probes the full failure envelope under combined loading.
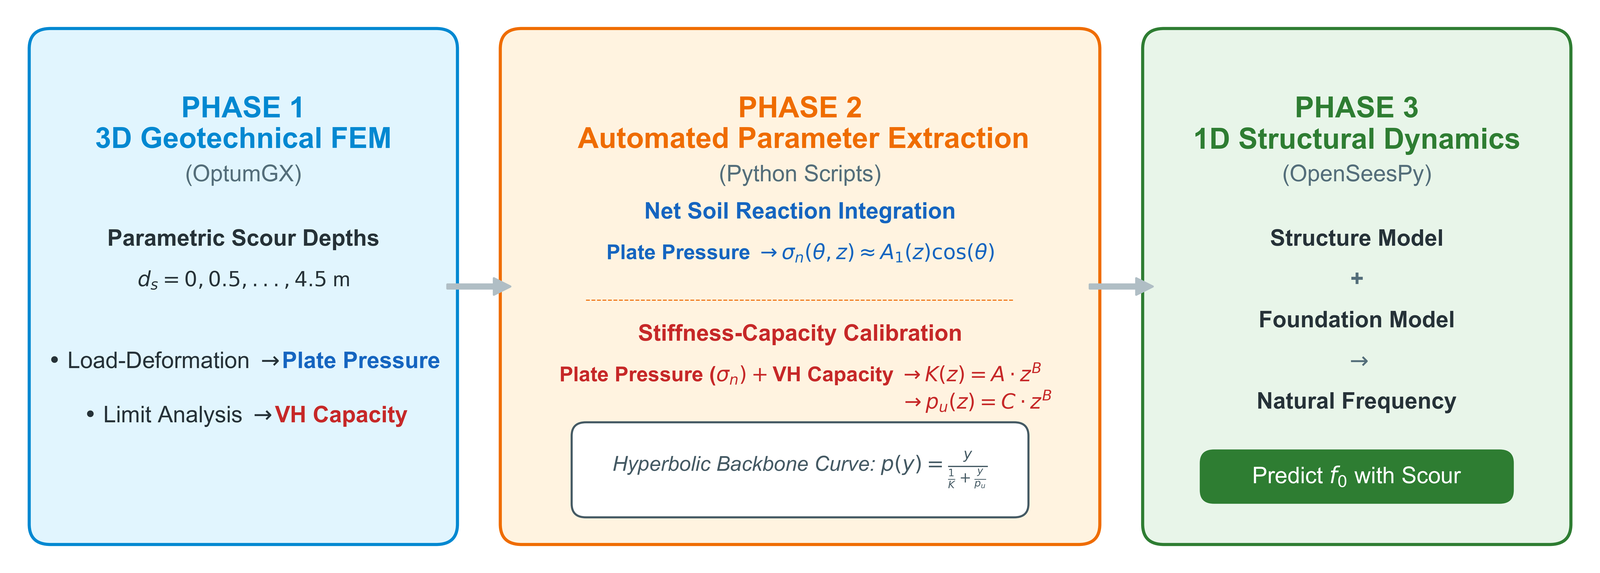
Figure 2: Computational Pipeline: High-fidelity 3D Geotechnical Finite Element Analysis (OptumGX) provides load-deformation data and limit analysis results. Python scripts extract contact pressures and perform Fourier decomposition to obtain depth-varying stiffness profiles. The calibrated spring parameters feed into 1D structural dynamics simulation (OpenSeesPy) for eigenvalue analysis. The workflow transforms contact pressure fields with millions of degrees of freedom into discrete spring parameters while preserving energy consistency.
The workflow comprises two parallel data streams that converge at the calibration stage. The stiffness extraction branch derives depth-varying spring coefficients from load-deformation analyses, while the capacity determination branch establishes global failure limits through VH envelope analysis. The convergence of these branches enforces integral energy consistency: the summation of local spring capacities must equal the global failure load obtained from limit analysis, ensuring that the 1D discretization reproduces the total work done by the 3D continuum rather than merely fitting scattered data points.
Phase 1 executes 3D geotechnical finite element analysis using OptumGX for two distinct purposes. Load-deformation analyses apply a target displacement of 80 mm (corresponding to 1% of the 8 m bucket diameter) to extract secant stiffness, using only data within the quasi-linear soil response regime. Concurrently, limit analysis determines VH capacity envelopes through systematic probing of the combined vertical-horizontal load space via parametric angular sweep. Both analysis types are repeated across eleven scour depths (\(d_s\)) scenarios spanning 0 to 4.5 m in 0.5 m increments.
Phase 2 performs automated parameter extraction through Python post-processing scripts. Raw pressure data contains numerical noise and abnormal values. Thus, contact pressure fields from the 3D simulations (OptumGX) are fitted using regression via Fourier decomposition to isolate the first harmonic coefficient, which represents the net lateral resistance excluding axisymmetric confinement effects. The extracted stiffness data from all scour scenarios are stored into a single ensemble dataset and fitted to a power-law function \(K_{py}(z) = A \cdot z^B\), yielding a site-specific depth exponent for the reference site. Spring capacities are then calibrated by enforcing an integral constraint against the VH capacity envelope, ensuring global equilibrium is satisfied.
Phase 3 constructs the 1D structural dynamics model in OpenSeesPy using a distributed BNWF foundation model. This novel foundation model comprises a central spine of beam-column elements with distributed lateral springs (\(p-y\)) attached, while four radial beam elements at each depth slice connect the spine to perimeter nodes where vertical springs provide distributed skin friction (\(t-z\)). Tapered sections for the tower geometry are considered using user-defined beam by integration of Gauss-Lobatto interpolation. Distributed masses representing the soil plug, marine growth, hydrodynamic added mass, and rotor-nacelle assembly are assigned to appropriate nodes prior to eigenvalue analysis. Stress-corrected spring formulations account for effective stress reduction in soil below the scoured mudline.
Phase 1: High-Fidelity 3D Finite Element Analysis
Reference Structure and Site Conditions
The validation structure is the 4.2 MW Gunsan offshore wind turbine supported by a tripod bucket foundation in the Gunsan, South Korea (Fig. 3). This installation represents one of the first commercial-scale tripod bucket foundation systems in Korea, providing a unique validation opportunity. This field-demonstration project has been the subject of extensive prior characterization including dynamic response monitoring during installation stages [7], full-scale vibration testing [5], and innovative single-day installation methodology development [23], establishing a comprehensive baseline for the present validation.
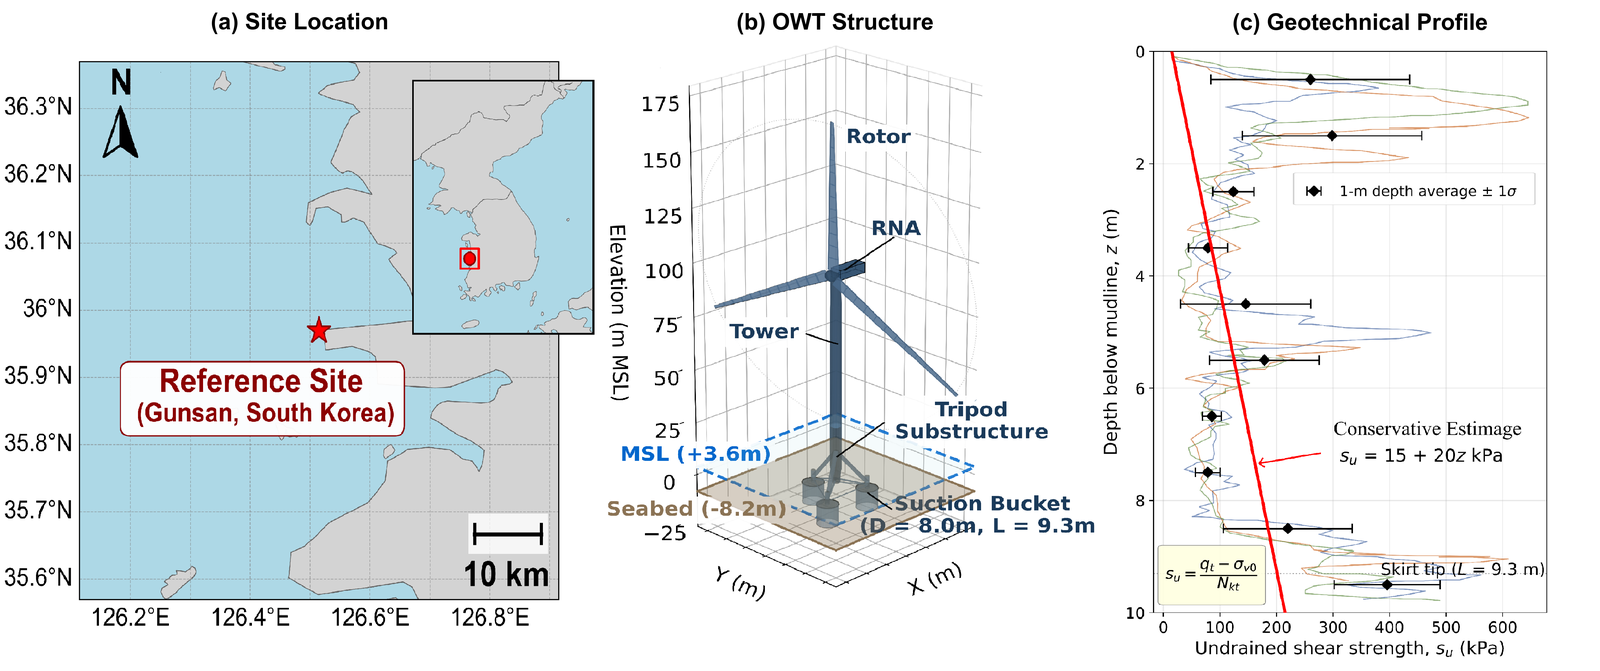
Figure 3: Reference structure and geotechnical setting: (a) Offshore wind turbine location in Gunsan, South Korea; (b) 4.2 MW tripod jacket with three suction bucket foundations (\(D\)=8m, \(L\)=9.3m); (c) undrained shear strength profile \(s_u = 15 + 20z\) kPa characteristic of normally consolidated marine clay.
The reference site selection was strategic for the field-demonstration purposes led by Korean Electric Power Corporation (KEPCO). Gunsan marine clays exhibit normally consolidated behavior with well-characterized strength gradients of 20 kPa/m, enabling application of the Tresca constitutive model. The tripod configuration provides load-path redundancy absent in monopiles, while the aspect ratio of 1.16 (shallow footing regime) places this foundation squarely in the regime where empirical pile-based p-y curves demonstrably fail, for empirical pile-based p-y curves developed for aspect ratios exceeding 10 [8]. Table 1 shows the foundation and Tresca soil parameters for the accurate soil-structure modeling of the reference 4.2 MW Gunsan offshore wind turbine.
Table 1: Foundation and Soil Parameters
| Parameter | Symbol | Value |
|---|---|---|
| Bucket diameter | \(D\) | 8 m |
| Skirt Length | \(L\) | 9.3 m |
| Aspect ratio | \(L/D\) | 1.16 |
| Mudline undrained strength | \(s_{u0}\) | 15 kPa |
| Depth-dependent gradient | \(k\) | 20 kPa/m |
| Total unit weight | \(\gamma\) | 19 kN/m³ |
| Interface adhesion factor | \(\alpha\) | 0.67 |
3D FEM Model and Mesh
The 3D finite element model employs an axisymmetric-to-3D revolution approach with domain dimensions ensuring negligible boundary effects. The computational domain dimensions (domain length 10 times bucket diameter, domain height 7.5 times bucket diameter) exceed minimum far-field ratios, with boundary effects verified below 2% through separate sensitivity analyses:
The far-field ratio of 10 exceeds the minimum recommended value of 5 for laterally loaded foundations [24]. Fig. 4 illustrates the computational domain and mesh architecture.
The half-model approach exploits symmetry for computational efficiency, employing adaptive mesh refinement from 10,000 to 30,000 six-node triangular mixed-type elements. Fan meshing with 30° opening angle at skirt tips captures stress concentration gradients essential for accurate plate pressure extraction. Standard fixities are applied: at the symmetric axis plane, roller boundary conditions are applied, whereas at the lateral and bottom side, pinned constraints are utilized.
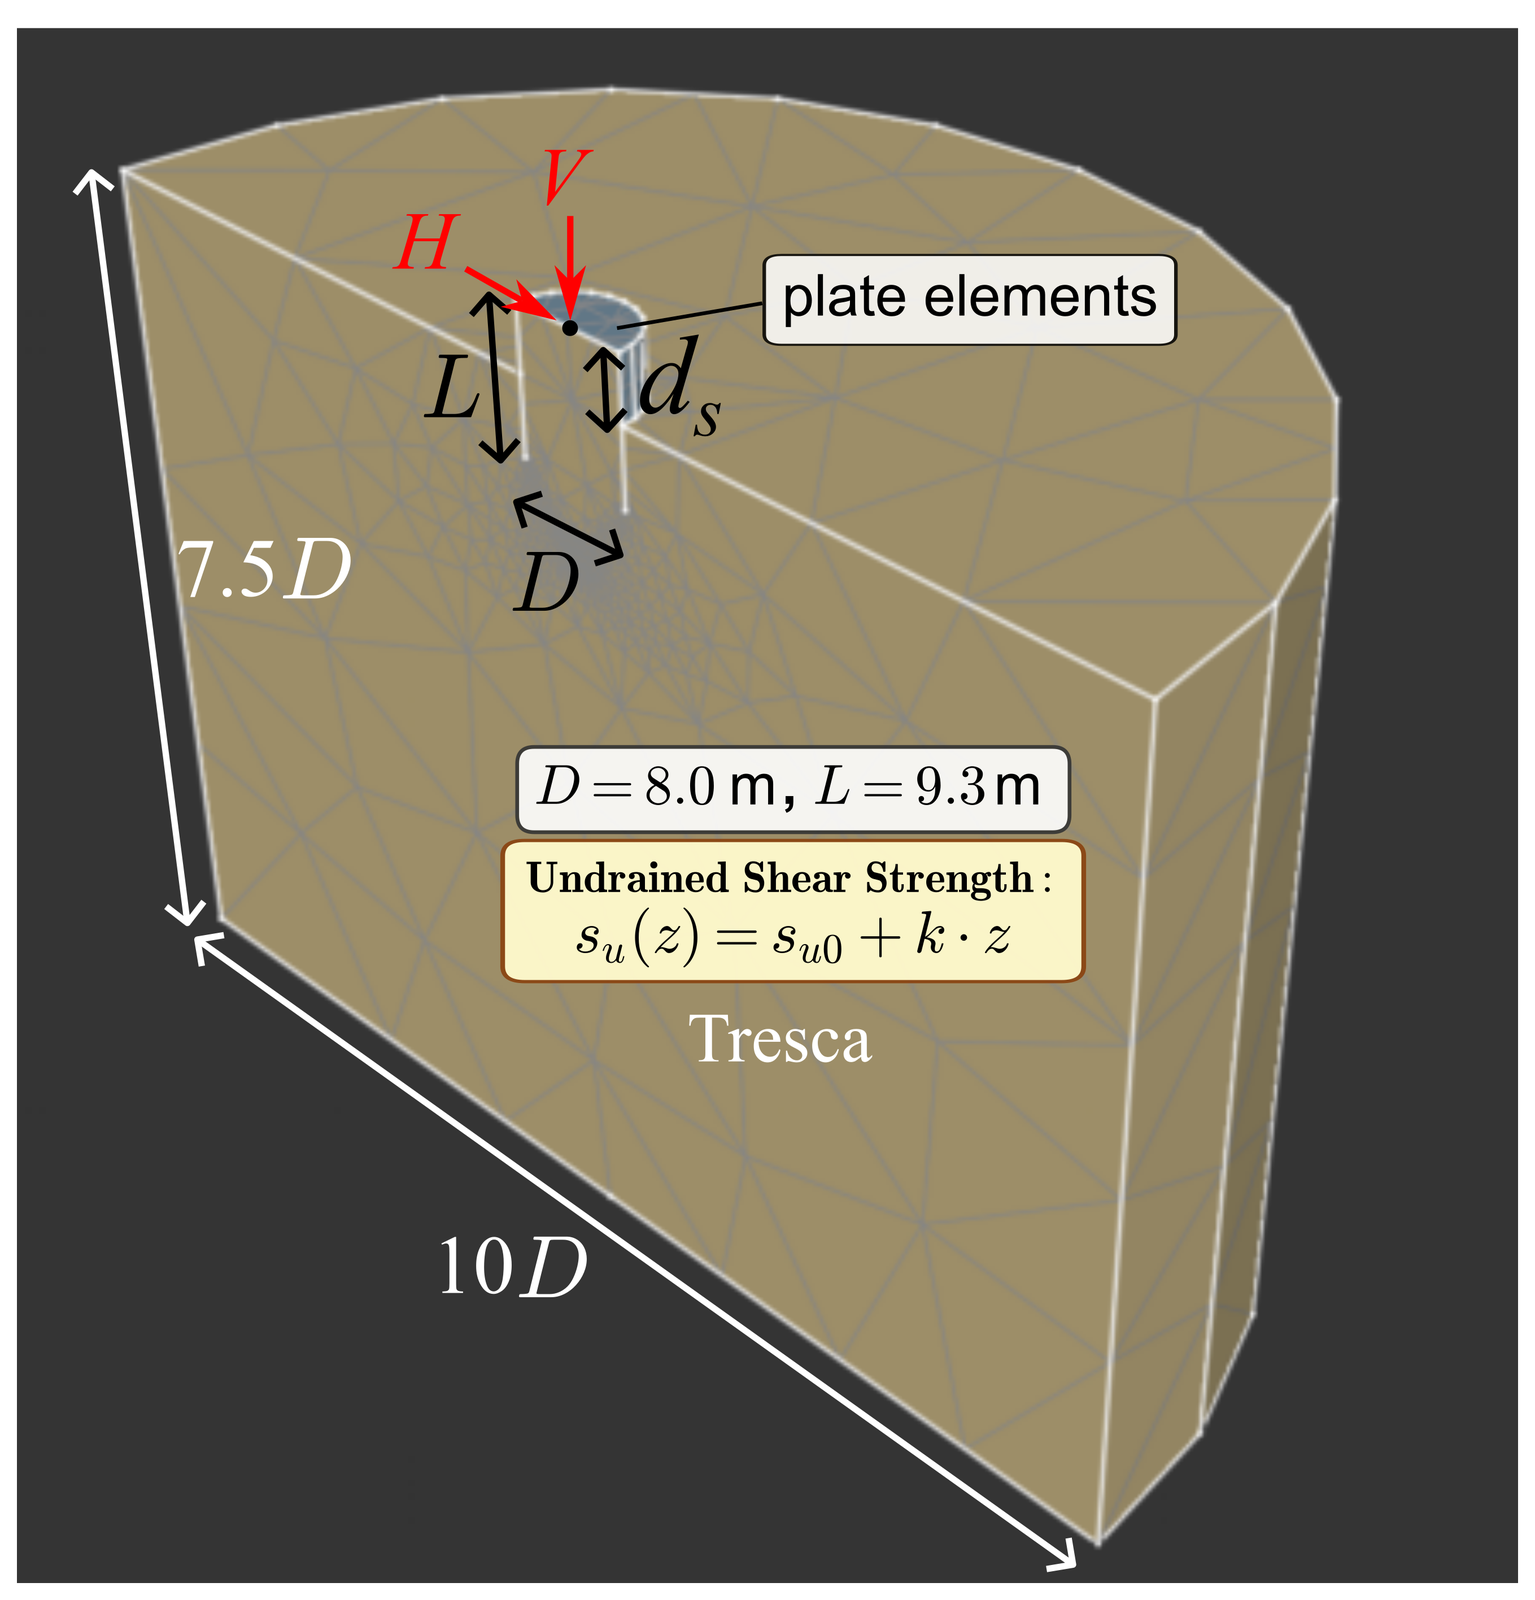
Figure 4: 3D Finite Element Domain (OptumGX) Computational Configuration: Half-model geometry exploiting symmetry with adaptive mesh with refinement at skirt tips and contact interface
The soil constitutive model employs the Tresca total stress undrained formulation, appropriate for rapid storm loading where drainage cannot occur, for the linearly increasing strength profile:
Mesh resolution involves a critical trade-off between global convergence and local field fidelity. As demonstrated in the efficiency frontier analysis (Figure ), global horizontal capacity converges rapidly; the relative error drops to 2.69% at 4,000 elements and falls below 1% beyond 15,000 elements (Fig. 5).
However, extracting continuous contact pressure fields for Fourier decomposition requires significantly finer resolution than global limit loads. Stress singularities near skirt tips demand local refinement to prevent discretization artifacts from contaminating the first harmonic (\(A_1\)) with numerical noise. Consequently, a high-resolution discretization of 30,000 elements was adopted for the parameter extraction phase in this study. While this involves a computational investment of approximately 1,418 seconds (24 minutes) per scenario, it ensures that derived spring parameters remain invariant of mesh discretization.
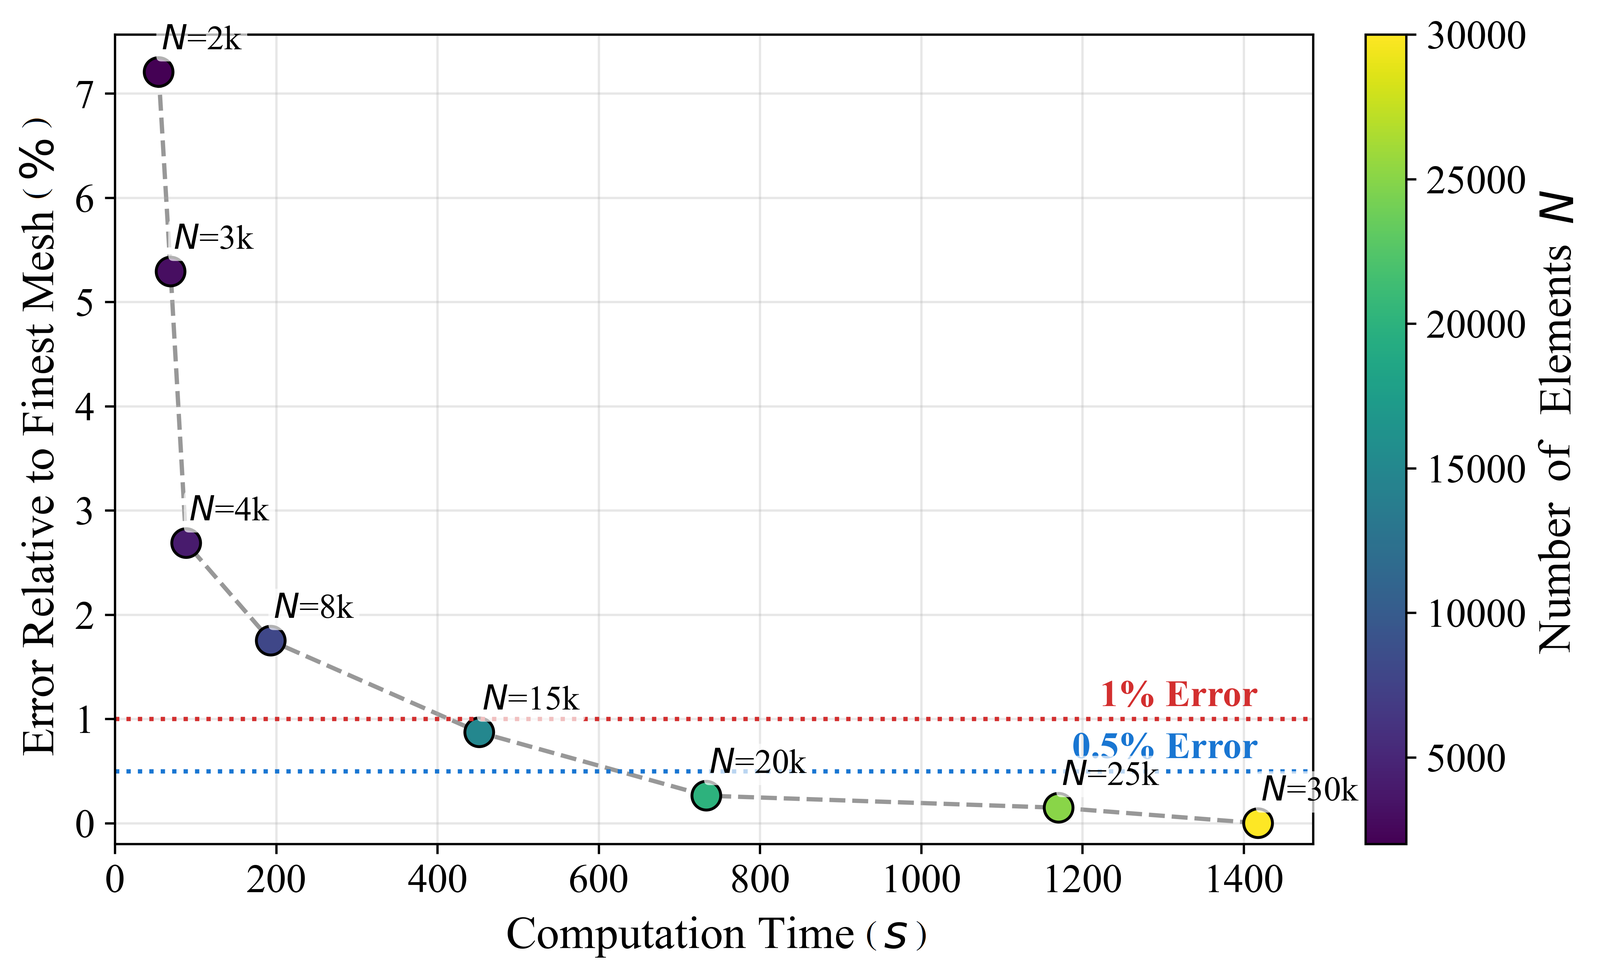
Figure 5: Efficiency Frontier: Numerical Accuracy vs. Computational Cost
Scour Modeling
The model simulates scour by lowering the far-field soil surface, thereby modifying the geometric domain. This approach captures three coupled effects: reduced effective embedment, upper skirt exposure (eliminating soil contact along the exposed length), and altered stress state in remaining soil due to overburden loss.
The uniform scour assumption adopted throughout this study serves as a foundational global benchmark rather than a claim that all field scour is circumferentially uniform. While local scour produces asymmetric stress distributions around individual buckets, uniform scour provides the conservative baseline required for two framework objectives. First, for global modal sensitivity analysis, circumferentially symmetric degradation ensures that extracted frequency shifts reflect depth-dependent stiffness loss without geometric bias from directional scour patterns. Second, for real-time monitoring applications, the 1D model requires axisymmetric stiffness profiles that can be updated without resolving three-dimensional scour geometry. Extension to local scour, requiring explicit treatment of asymmetric pressure distributions and potential torsional mode coupling, represents a natural future enhancement once the uniform benchmark is established.
The parametric study spans eleven scenarios with scour depths from 0 to 4.5 m in 0.5 m increments. The 4.5 m case representing 48% embedment loss reflects severe scour conditions consistent with offshore monitoring observations [25].
Interface Friction
The interface friction factor \(\alpha = 0.67\) reflects the industry-standard lower bound for normally consolidated marine clays per DNV-RP-C212 [9]:
This value represents the conservative design envelope for suction-installed foundations in soft clays, accounting for smooth factory-finished steel surfaces and installation-induced soil remolding. Field and laboratory studies on normally consolidated marine clays consistently report interface adhesion factors in the range \(0.5 \leq \alpha \leq 1.0\), with \(\alpha = 0.67\) representing a representative lower-bound estimate that captures installation disturbance without overstating post-consolidation strength recovery. The resulting 3.3% underprediction against field data confirms this selection yields operationally conservative stiffness estimates.
Load Displacement Analysis
For load displacement analysis used in stiffness extraction, loading conditions are applied at the bucket lid center point with free lateral and vertical translation, fixed transverse direction for symmetry constraint, fixed vertical direction to prevent non-physical uplift, and all rotations fixed to suppress torsion and moment transfer. The multiplier loading option enables incremental loading from zero to target displacement of 80 mm (\(0.01D\)) over eight linearly-varying steps, providing load-displacement curves at small-strain regime. This mobilizes enough soil resistance for stiffness extraction but stays within the quasi-linear regime. We extracted secant stiffness at 1%, not the initial tangent stiffness governing dynamic response at strains below 0.01% for real-world compatibility. Laboratory data [26] show that the ratio of maximum to secant shear modulus ranges from 2 to 5 for clays at 1% strain. Direct use of finite element-extracted stiffness would systematically underestimate the true small-strain foundation stiffness.
VH Capacity Analysis
For VH capacity analysis, the boundary conditions are modified from previous stage to permit vertical displacement, and combined loading is applied via vector decomposition as described below.
The VH capacity envelope is determined through systematic probing of the combined vertical-horizontal load space. Three bounding capacities are established through limit analysis: maximum vertical tension capacity representing uplift resistance from plug weight and suction, maximum vertical compression capacity representing bearing capacity under vertical loading, and maximum horizontal capacity representing lateral resistance with vertical restraint.
The collapse load multiplier yields failure loads for horizontal and vertical components at each angular position. Subsequently, 20 intermediate combinations are evaluated via parametric angular sweep from 0° to 180° with load decomposition:
Phase 2: Automated Parameter Extraction
The translation of 3D continuum results into 1D Winkler spring parameters (\(p-y\), \(t-z\), and \(Q-z\)) is automated to ensure consistency across all scour scenarios. This phase bridges the gap between 3D geotechnical simulations (OptumGX) and efficient 1D structural dynamics (OpenSees) by extracting soil reaction profiles from 3D contact pressure fields in small-strain stiffness regime in load-deformation analysis and VH capacity from the limit analysis.
Step 1: Net Soil Reaction Integration
To derive the 1D stiffness parameters, we processed contact pressure and shear stress fields for all plate elements corresponding to the suction bucket foundation from the load-deformation analyses. For each depth slice along the bucket skirt, the normal contact pressure (\(\sigma_n\)) and vertical shear stress (\(\tau_{rz}\)) were extracted directly from each load step.
OptumGX utilizes 6-node triangular plate elements with a mixed formulation (viz., [27]), featuring quadratic displacement interpolation and linear stress interpolation at the vertices. In this formulation, the contact pressure—representing the total normal stress on the soil-structure interface—serves as a primary solution variable. By collecting these pressures alongside Euclidean geometric variables (\(X, Y, Z\) coordinates) and nodal displacements for each element, we obtain a continuous pressure field free of inter-element discontinuities. The normal contact pressure \(\sigma_n\) is extracted directly from the three vertex nodes of each triangular interface plate element.
The pressure field \(\sigma_n(\theta, z)\) over the element domain \(\Omega_e\) is reconstructed via linear interpolation of these nodal values \(P_i\):
where \(N_i\) are the linear shape functions and \(P_i\) are the discrete nodal pressures extracted from the simulation results (Fig. 6). This formulation yields a \(C^0\)-continuous pressure field across element boundaries, ensuring high-fidelity input for the subsequent harmonic analysis.
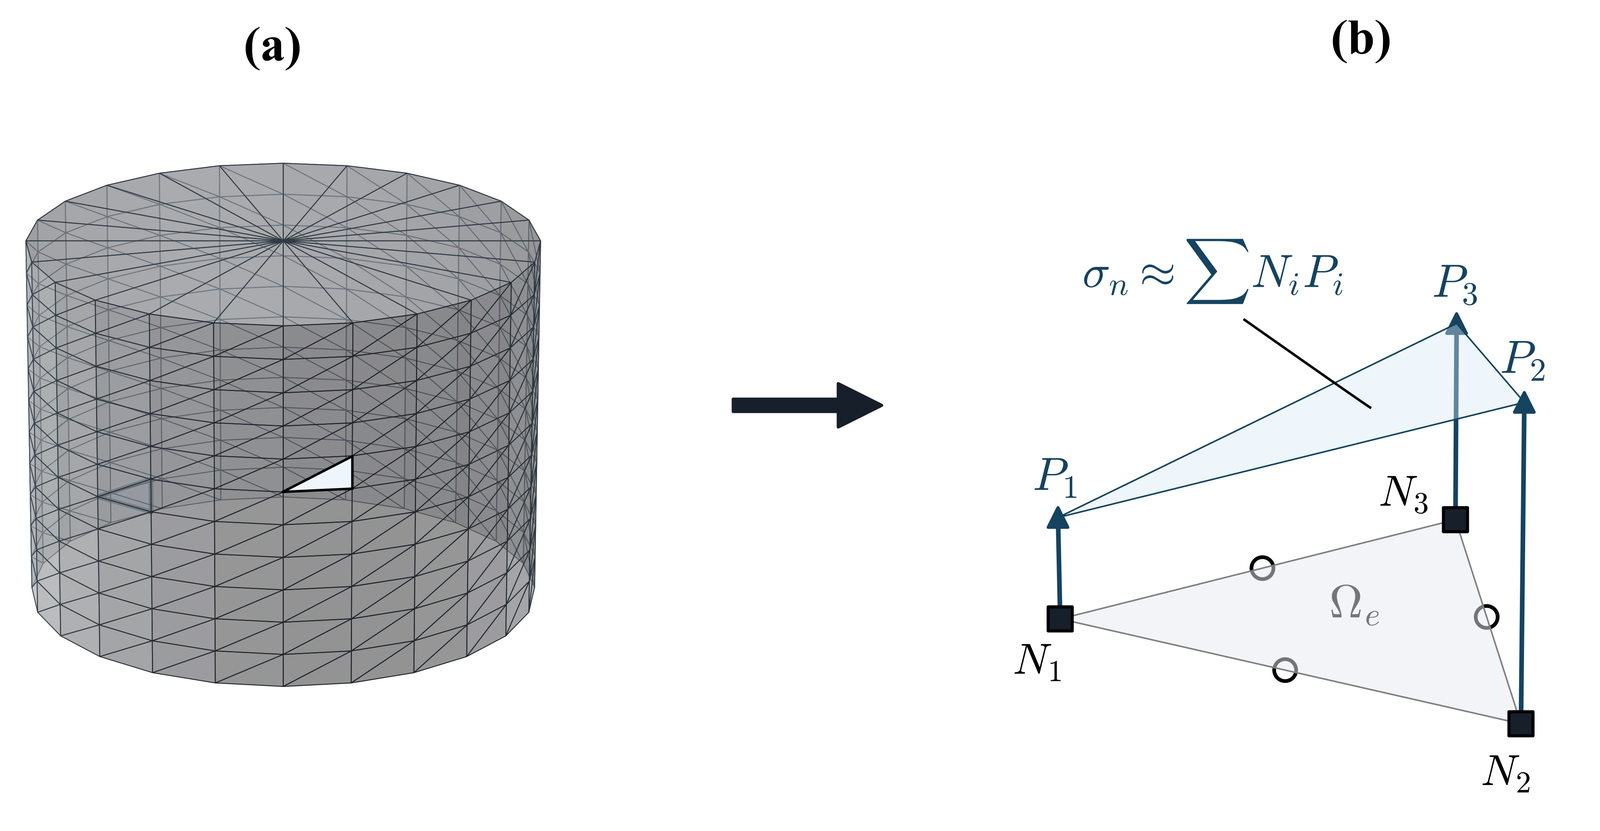
Figure 6: (a) Suction bucket foundation mesh discretization (b) Plate element with mixed element formulation illustrating contact pressure
Because the raw contact pressure field contains both the resistance to lateral sway and axisymmetric confinement components (Poisson effect), a direct summation would overestimate lateral stiffness. Direct summation of this raw contact pressure field would overestimate lateral stiffness because it contains both the resistance to lateral sway and the axisymmetric confinement pressure induced by the Poisson effect (radial expansion). To isolate the net lateral resistance, the circumferential pressure distribution \(\sigma_n(\theta)\) at each depth \(z\) was decomposed into its fundamental Fourier harmonics:
The zeroth harmonic \(A_0\) represents the axisymmetric confinement, which performs zero work during lateral translation. The first harmonic coefficient \(A_1\) quantifies the amplitude of the differential pressure resisting sway. The net lateral reaction force \(p(z)\) was derived by integrating this effective component over the bucket circumference:
The initial stiffness \(k_{raw}(z)\) was then calculated as the secant modulus of the resulting \(p(z)\)–\(y\) curve at a small-strain normalized displacement (\(y \approx 0.01\% D\)).
To characterize the site-specific stiffness profile and eliminate numerical noise, the stiffness data from all eleven scour scenarios were pooled into a single ensemble dataset. A master power-law function was fitted to this pooled data:
where \(z\) is the local depth below the current mudline. This regression yielded a site-specific exponent of \(B = 0.72\), which serves as the fundamental shape parameter for the soil’s depth-dependent response.
Similarly, the unit shaft friction \(t(z)\) was calculated by averaging the vertical shear stresses acting on the inner and outer skirt surfaces at each depth. The initial stiffness \(k_{raw}(z)\) was then calculated as the secant modulus of the resulting \(p(z)\)–\(y\) and \(t(z)\)–\(z\) curves at a small-strain normalized displacement.
The tip stiffness (\(Q-z\)) was extracted as a discrete value from the base of the soil plug at the baseline (no-scour) condition and held stationary at that global elevation for all subsequent scour cases.
To characterize the site-specific stiffness profiles, the data from all scour scenarios were pooled into a single ensemble dataset. The power-law functions were fitted to this pooled data:
where \(z\) is the local depth below the current mudline. This regression yielded site-specific exponents of \(B_p = 0.72\) for lateral response and \(B_t = 0.58\) for vertical shaft friction.
The pooled dataset was fitted as shown in Table 2. The fitted exponent lies between two well-established limiting cases embedded in geotechnical theory. For slender piles with aspect ratios exceeding 10, lateral resistance derives predominantly from distributed shaft friction mobilized along the embedded length, and the linear depth-dependency reflects the proportionality between undrained strength and effective stress in normally consolidated clays, yielding an exponent approaching unity.
Table 2: Stiffness Profile Parameters
| Mode | \(A\) (N/m\(^{1-B}\)) | \(B\) | \(R^2\) |
|---|---|---|---|
| Lateral (p-y) | \(2.3 \times 10^7\) | 0.72 | 0.94 |
| Vertical (t-z) | \(4.2 \times 10^8\) | 0.58 | 0.91 |
For surface or near-surface foundations, resistance concentrates in the upper soil layers where bearing capacity factors dominate, and the negligible depth-dependency reflects the kinematic constraint that failure mechanisms remain confined to a zone of influence proportional to foundation width rather than depth, yielding an exponent approaching 0. The intermediate value of 0.72 for suction buckets with aspect ratio approximately 1 encodes the hybrid mechanics at this site: the lid bearing contribution activates simultaneously with skirt friction, creating coupled resistances that produce depth-dependency stronger than footings but weaker than piles.
Once the power-law coefficients are extracted, the resulting 1D model executes eigenvalue analysis. This one-time high-fidelity investment enables real-time frequency prediction for the entire asset lifecycle, resolving the temporal-scale mismatch between 3D geotechnical analysis and operational monitoring for field utilization.
Step 2: Hybrid Stiffness-Capacity Calibration
While stiffness parameters were derived from local contact pressure fields, the ultimate capacity of each spring was calibrated using a hybrid approach that enforces consistency between local distribution and global stability. We assumed the local ultimate resistances (\(p_{ult}\) and \(t_{ult}\)) follow the same depth-dependent power-law shapes (\(B_p\) and \(B_t\)) derived in Step 1.
The scaling coefficient \(C\) for the capacity profile \(p_{ult}(z) = C \cdot z^B\) was derived by enforcing an integral constraint: the sum of all local spring capacities must equal the global failure load of the continuum model:
Solving for \(C\) yields the fully defined capacity profile:
The magnitudes were anchored to the Global Horizontal Capacity (\(H_{ult}^{VH}\)) and Global Vertical Capacity (\(V_{ult}^{VH}\)) identified from the 3D VH-interaction envelopes. The local ultimate shaft friction \(t_{ult}(z)\) was derived by enforcing an integral constraint such that the sum of local frictions and the constant tip resistance (\(q_{ult}\)) matched the global vertical limit:
By solving for the respective scaling coefficients, the fully defined capacity profiles were generated for every scour depth. This hybrid calibration ensures that the 1D model preserves the site-specific depth gradients identified in the stiffness analysis while simultaneously satisfying the rigorous global stability limits determined by the limit analysis.
Step 3: Hyperbolic Backbone Construction
The final 1D soil-structure interaction model was constructed in OpenSeesPy using nonlinear Winkler springs distributed throughout the suction bucket foundation. We model the force-displacement responses (i.e., lateral (\(p-y\)) and vertical (\(t-z\)) springs) using a simple hyperbolic backbone curve:
where the parameters are updated at each node based on the local depth \(z\). \(K_{py}\), \(K_{tz}\), \(p_{ult}\) and \(t_{ult}\) are the depth-dependent stiffness and capacity parameters calibrated using previous steps.
This formulation decouples stiffness extraction at small strains from capacity determination at limit state, ensuring the 1D model reproduces both dynamic response and ultimate capacity of the parent 3D finite element model through integral energy consistency. Scour-induced evolution of lateral and vertical spring stiffnesses are shown in Fig. 7.
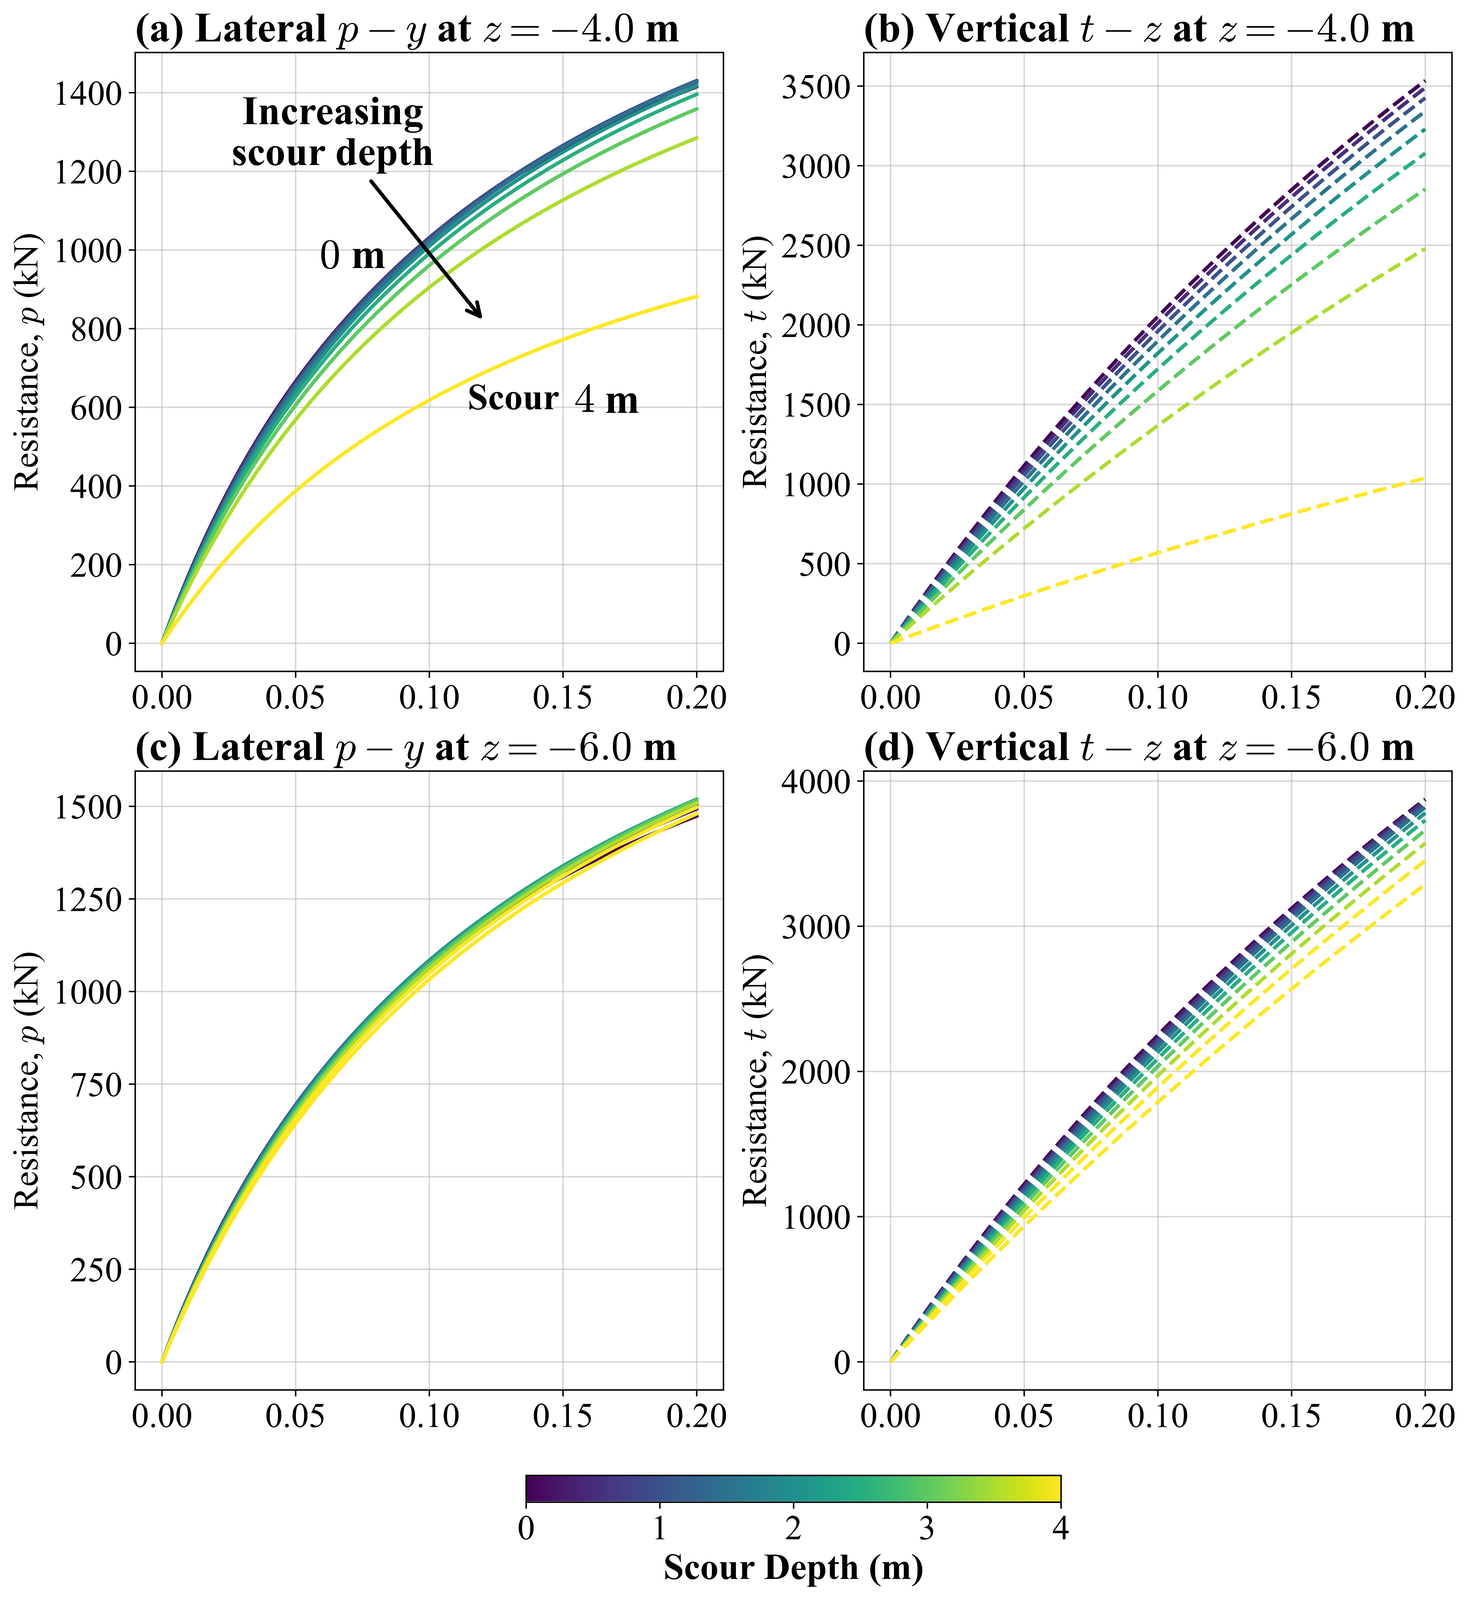
Figure 7: Scour-induced evolution of lateral (p-y) and vertical (t-z) spring stiffness profiles extracted: (a)-(b) at depth of 4 m; (c)-(d) at depth of 6 m
Phase 3: Structural Dynamics (OpenSeesPy)
Reference Structure and Finite Element Formulation
The structural dynamics model is constructed in OpenSeesPy, implementing a frame formulation with six degrees of freedom per node (Figure~). The reference structure, the 4.2 MW Gunsan offshore wind turbine, comprises a tubular steel tower supported by a tripod suction bucket foundations. All geometric and material properties are extracted from a source database derived from manufacturer drawings, as-built documentation, and the official structural calculation reports provided by KEPCO [28].
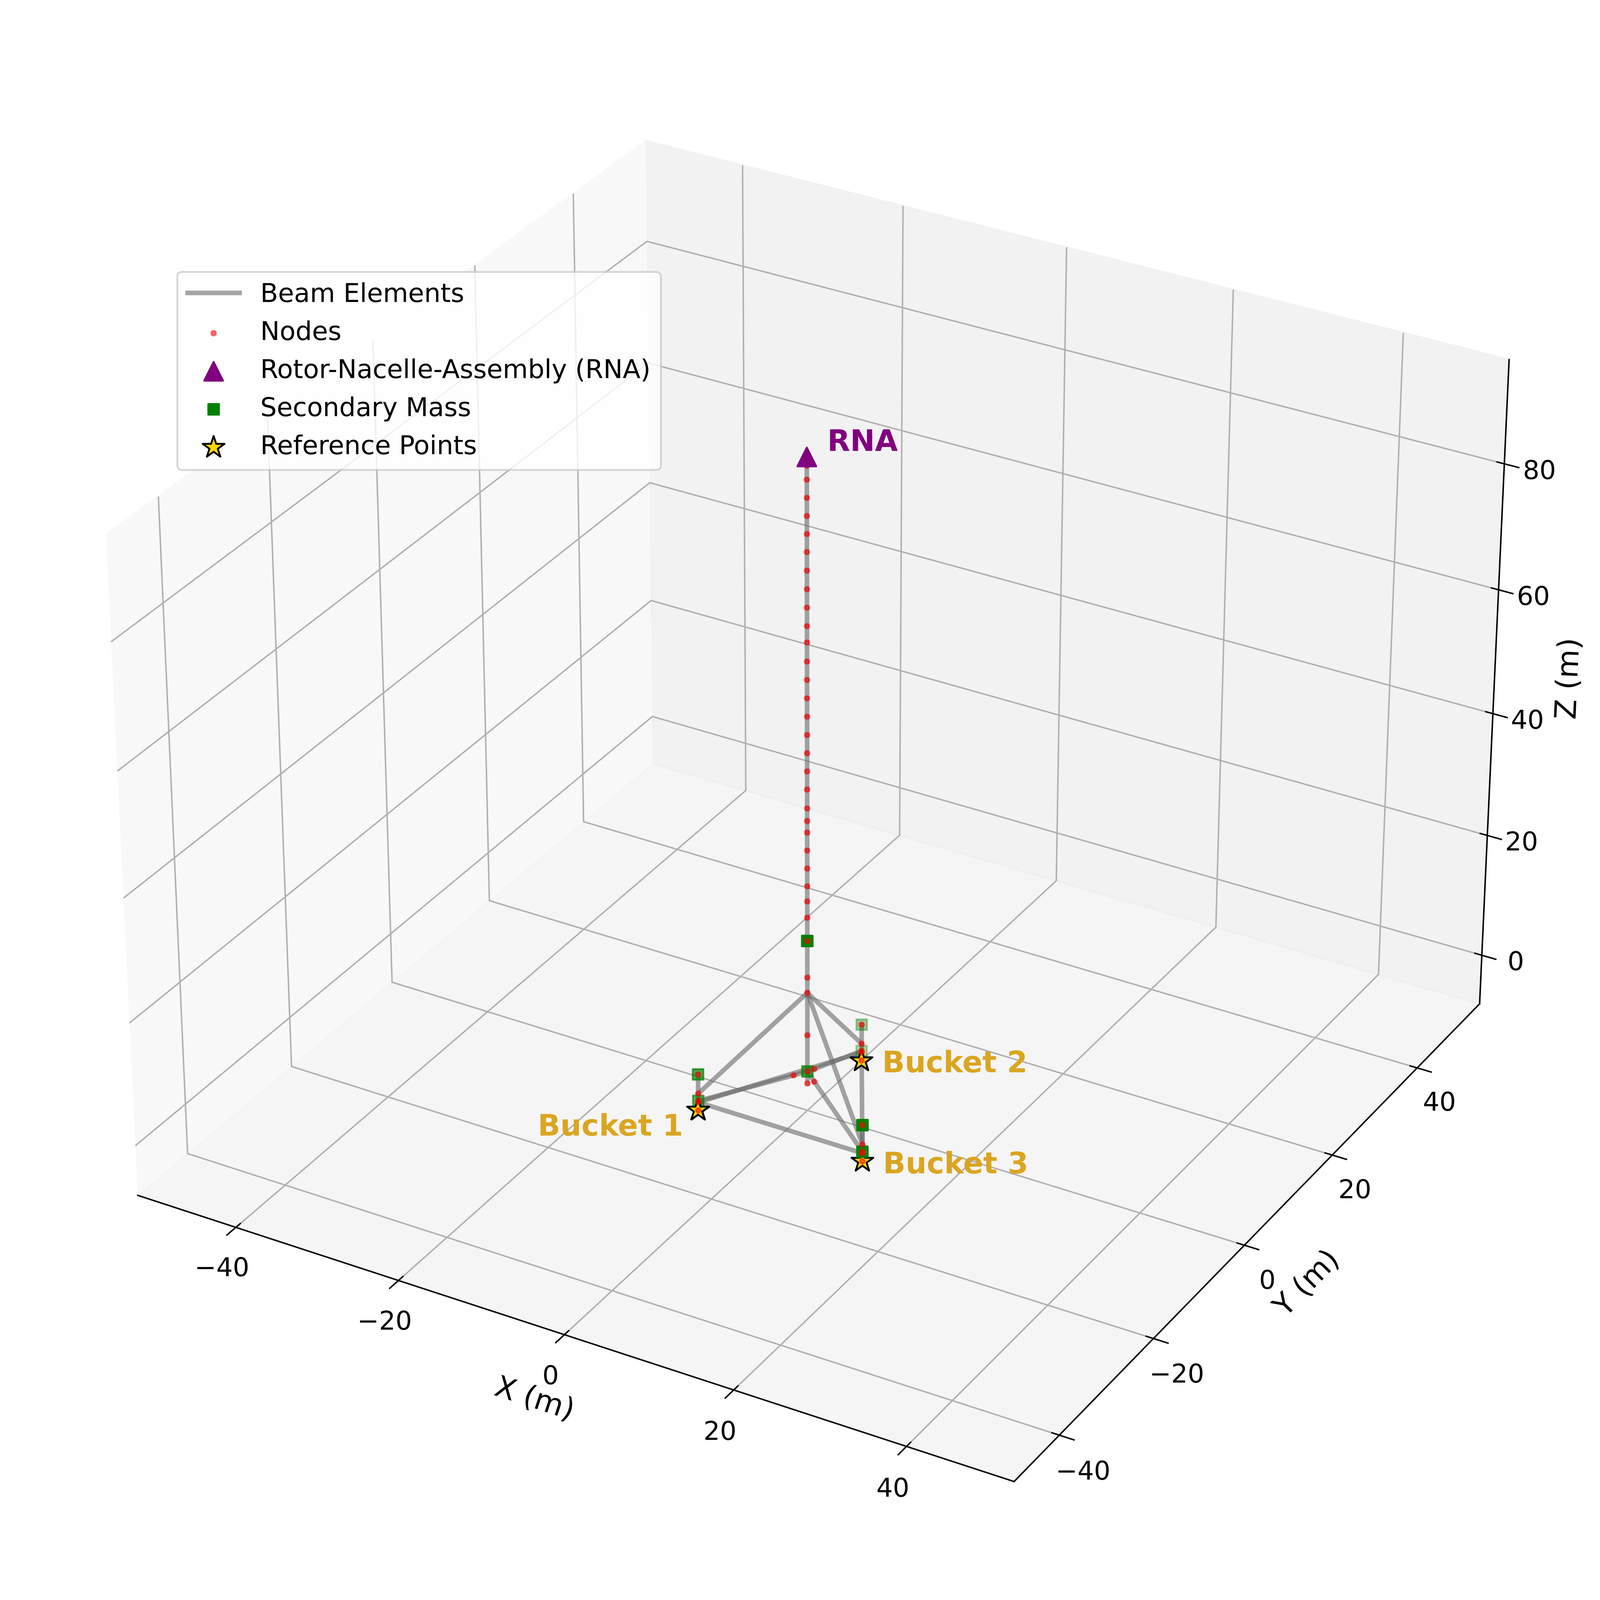
Figure 8: 3D structural dynamics model (OpenSeesPy)
Table 3: Structural Parameters of the 4.2 MW Gunsan OWT
| Parameter | Symbol | Value |
|---|---|---|
| Young’s modulus | \(E\) | \(2.10 \times 10^{11}\) Pa |
| Shear modulus | \(G\) | \(8.10 \times 10^{10}\) Pa |
| Steel density (nominal) | \(\rho_{\text{steel}}\) | 7850 kg/m³ |
| Steel density (effective) | \(\rho_{\text{eff}}\) | 8243 kg/m³ |
| RNA mass | \(M_{\text{RNA}}\) | 280,529 kg |
| Tower height | \(H_{\text{tower}}\) | 72.7 m |
| Tower bot diameter | \(D_{\text{bot}}\) | 4.20 m |
| Tower top diameter | \(D_{\text{top}}\) | 3.50 m |
| Tripod height | \(H_{\text{tripod}}\) | 23.5 m |
| Bucket diameter | \(D\) | 8.0 m |
| Skirt penetration | \(L\) | 9.3 m |
The 5% density increase applied to steel accounts for secondary masses including bolted connections, weld material, internal stiffeners, and access hardware that are not explicitly modeled but contribute to dynamic response. Concentrated masses from platforms, boat landings, J-tubes, and the rotor-nacelle assembly are applied directly at their physical locations as specified in the database. This approach follows offshore industry practice wherein structural mass is systematically underestimated when only primary structural elements are modeled.
Tapered Sections for the OWT Tower
The offshore wind turbine tower exhibits continuous diameter variation from 4.20 m at the base to 3.50 m at the nacelle interface. Accurate representation of this taper requires integration schemes that properly weight the spatially varying cross-sectional properties. The model employs user-defined beam integration with five Gauss-Lobatto points:
Table 4: Parameters for Tapered Tower Sections
| Point | Location \(\xi_i\) | Weight \(w_i\) | Normalized Position |
|---|---|---|---|
| 1 | \(-1.0\) | \(1/10\) | 0.000 |
| 2 | \(-\sqrt{3/7}\) | \(49/90\) | 0.173 |
| 3 | \(0.0\) | \(32/45\) | 0.500 |
| 4 | \(+\sqrt{3/7}\) | \(49/90\) | 0.827 |
| 5 | \(+1.0\) | \(1/10\) | 1.000 |
For prismatic elements with constant cross-section, standard Lobatto integration with five points is employed, achieving identical numerical accuracy with reduced preprocessing overhead. At each integration point, the cross-sectional diameter is linearly interpolated between element end values:
The corresponding section properties including area and moments of inertia are computed for hollow circular sections and assigned to independent elastic section objects. This approach ensures that the stiffness contribution from each segment is weighted according to the Gauss-Lobatto quadrature rule, providing exact integration for polynomial stiffness distributions up to degree 7.
Other Considerations
The dynamic response of offshore wind turbines is governed by effective mass that extends far beyond the structural steel. The OpenSees model implements five distinct mass categories, each essential for accurate frequency prediction. Submerged structural members accelerate the surrounding water, increasing effective inertia. The added mass per unit length follows the Morison formulation:
where \(C_a\) is the added mass coefficient equal to 1.0 for circular cylinders, \(\rho_{\text{water}}\) is 1025 kg/m³, and \(D_{\text{eff}}\) includes marine growth thickness. This mass is distributed to element end nodes in proportion to tributary length.
Marine growth increases both the effective diameter for hydrodynamic calculations and the gravitational mass. Following DNV-ST-0437 guidelines for Korean waters, marine growth thickness of 50 mm and density of 1400 kg/m³ are applied. The marine growth mass is computed as the annular ring volume multiplied by density, applied to all submerged elements below mean sea level.
The interior of each suction bucket contains entrapped soil that participates in the foundation’s dynamic response. The plug mass is computed as:
where \(\rho_{\text{plug}}\) is 1900 kg/m³ for saturated marine clay and \(L_{\text{eff}}\) equals skirt length minus scour depth, accounting for scour-induced reduction in effective embedment. At baseline with no scour, each bucket contributes approximately 887 tonnes of soil plug mass, yielding a total system contribution of approximately 2,661 tonnes from the three buckets.
Foundation Model Variations
To systematically evaluate the contribution of soil-structure interaction physics to frequency prediction, four distinct foundation modeling approaches were implemented and compared.
The Fixed Base model constrains all six degrees of freedom at the three reference nodes located at the bucket lid centers. This configuration provides an upper-bound frequency estimate by assuming infinite foundation stiffness. While computationally efficient, Fixed Base models cannot capture scour sensitivity by construction and predict identical frequency regardless of erosion state.
The Macro-Element model applies the full 6×6 stiffness matrix at each reference node:
with lateral stiffness of \(6.97 \times 10^8\) N/m, vertical stiffness of \(9.96 \times 10^8\) N/m, rotational stiffness of \(4.67 \times 10^{10}\) N-m/rad, and torsional stiffness of \(2.01 \times 10^{10}\) N-m/rad (KEPCO KEPRI Report, 2020). Macro-Element models capture foundation compliance at a single point but cannot represent the depth-varying stiffness distribution essential for scour sensitivity.
The standard Beam on Nonlinear Winkler Foundation (BNWF) approach idealizes the foundation by extending the bucket skirt below the mudline as a series of 1D beam-column elements. Soil-structure interaction (SSI) is represented through discrete lateral (\(p-y\)) and vertical (\(t-z\)) springs assigned at 0.5 m intervals along the embedded length. While these spring properties are derived from the site-specific stiffness scaling master profile and anchored to \(VH\) failure envelopes, the representation remains kinematically limited to a single central axis. Consequently, this model necessitates the assumption of a circumferentially uniform soil reaction, effectively collapsing the three-dimensional contact mechanics of the bucket into a mono-axial resistance field.
To overcome the limitations of axial symmetry, the proposed Distributed BNWF model utilizes a multi-node topology comprising a central structural spine supported by quadrantal radial appendages. At each discrete depth interval, four rigid radial beam elements connect the central spine to perimeter nodes at the bucket radius (\(R = 4.0\) m). This discretized architecture enables the direct mapping of Fourier-extracted circumferential pressure distributions onto the structural model, thereby preserving both the depth-dependent stiffness gradients and the spatial distribution of soil resistance. The 4-rib configuration, oriented at 90° intervals, is strategically selected to ensure isotropic modal response across orthogonal sway modes while maintaining the computational parsimony required for real-time structural health monitoring.
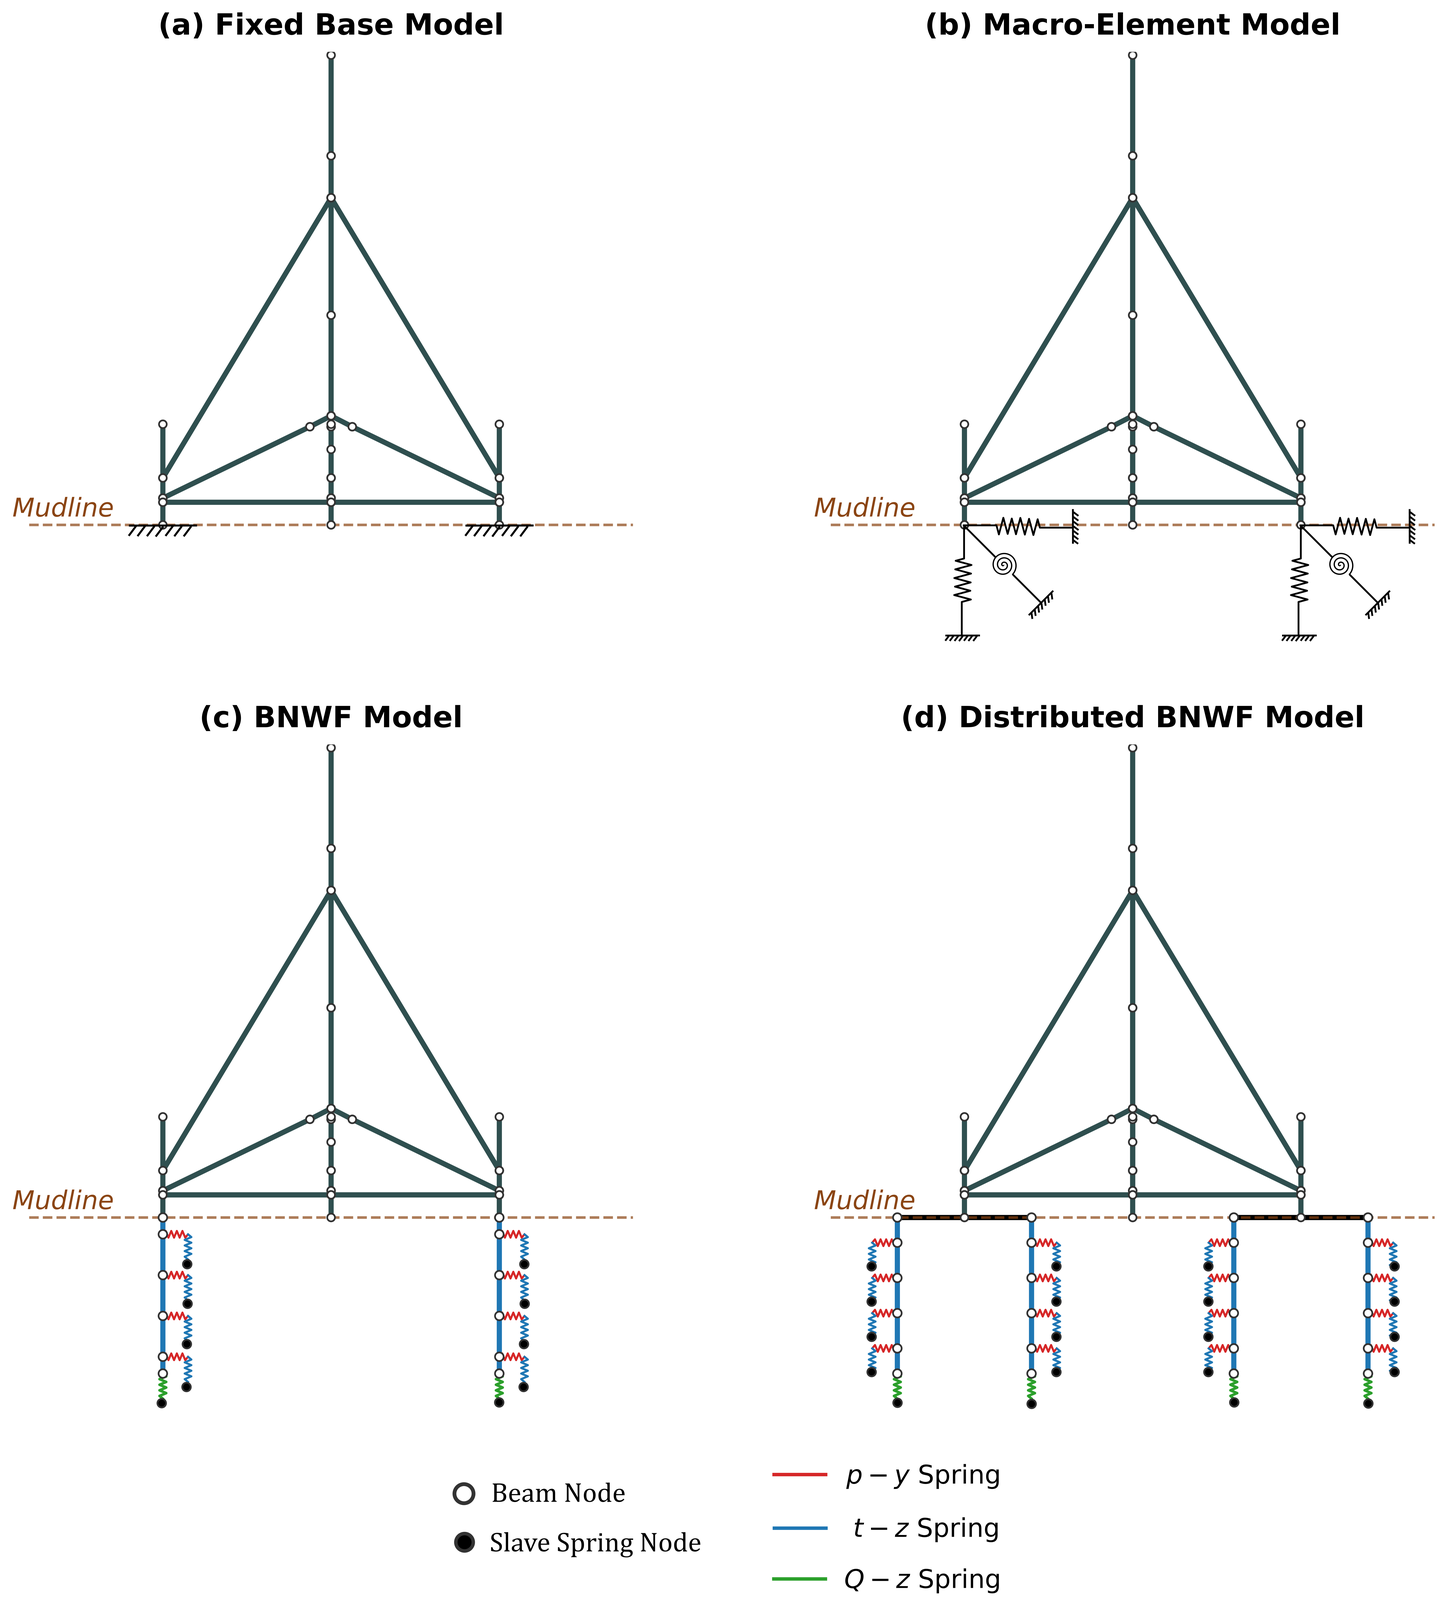
Figure 9: Foundation model variations: (a) Fixed Base model with rigid foundation; (b) Macro-Element (6×6 stiffness matrix) at reference points; (c) BNWF with uniform spring distribution; (d) Distributed BNWF with springs from the proposed framework.
The Distributed BNWF model utilizes a specialized 4-rib topology at 90° intervals, a configuration strategically selected to ensure energy equivalence and modal isotropy across orthogonal sway directions. This discretization serves as the numerical minimum required to map Fourier-extracted circumferential pressure distributions onto discrete supports without aliasing the isotropic continuum response, as confirmed by OpenSeesPy simulations yielding identical frequencies for both principal sway modes. Structurally, the foundation is modeled as a central spine of beam-column elements representing the bucket skirt, integrated with four radial ribs per depth slice that host vertical zero-length springs for distributed skin friction at the perimeter, while lateral resistance is provided by zero-length springs at the central spine nodes. The efficacy of this architecture is substantiated by system-level validation, where prediction errors of 3% against centrifuge data and 3.3% against field measurements confirm that any discretization-induced artifacts remain negligible within the context of overall model uncertainty.
Stress-Corrected Spring Formulation
Conventional numerical approaches for scour assessment typically utilize a binary truncation method, whereby springs located above the post-scour mudline are simply deleted. However, this simplification neglects the secondary geotechnical consequence of scour: the reduction in stiffness of the remaining sub-mudline soil resulting from the removal of overburden. The proposed framework addresses this by dynamically adjusting the stiffness and capacity of every active spring based on the instantaneous change in effective stress. Grounded in classical soil mechanics, this formulation recognizes that the small-strain shear modulus, \(G_{max}\), scales with effective stress according to a power-law relationship, typically characterized by an exponent of 0.5 for sands and clays [26]:
For a soil element situated at an absolute depth \(z_{abs}\) below the original mudline, the stress correction factor \(\xi\) is defined by the ratio of post-scour to pre-scour vertical effective stress:
Table 5 illustrates the impact of this confinement stress correction for a soil element at an absolute depth of 5.0 m. As scour depth increases from 0.0 to 4.0 m, the effective stress at this fixed elevation drops from 50 kPa to 10 kPa, resulting in a stiffness multiplier of 0.45. This reduction represents a 55% loss in local stiffness that would be entirely ignored by conventional spring-deletion models
Table 5: Stress Correction Factors
| Scour (m) | Local Depth \(z'\) | \(\sigma'\) (kPa) | \(\xi\) | \(K\) Multiplier | \(p_{\text{ult}}\) Multiplier |
|---|---|---|---|---|---|
| 0.0 | 5.0 | 50 | 1.00 | 1.00 | 1.00 |
| 2.0 | 3.0 | 30 | 0.77 | 0.77 | 0.60 |
| 4.0 | 1.0 | 10 | 0.45 | 0.45 | 0.20 |
Results
Effect of Scour on Stiffness and VH Capacity
Stiffness Evolution and Confinement-Dependent Softening
Fig. 10 illustrates the dual degradation mechanism governing suction bucket foundation response under progressive scour. While conventional models focus exclusively on the geometric truncation of the mudline, the proposed framework captures the simultaneous reduction in stiffness of the remaining soil column due to overburden removal. This phenomenon is manifested as a systematic leftward shift of the stiffness-depth profiles as scour depth (\(d_s\)) increases from 0.0 m to 4.0 m
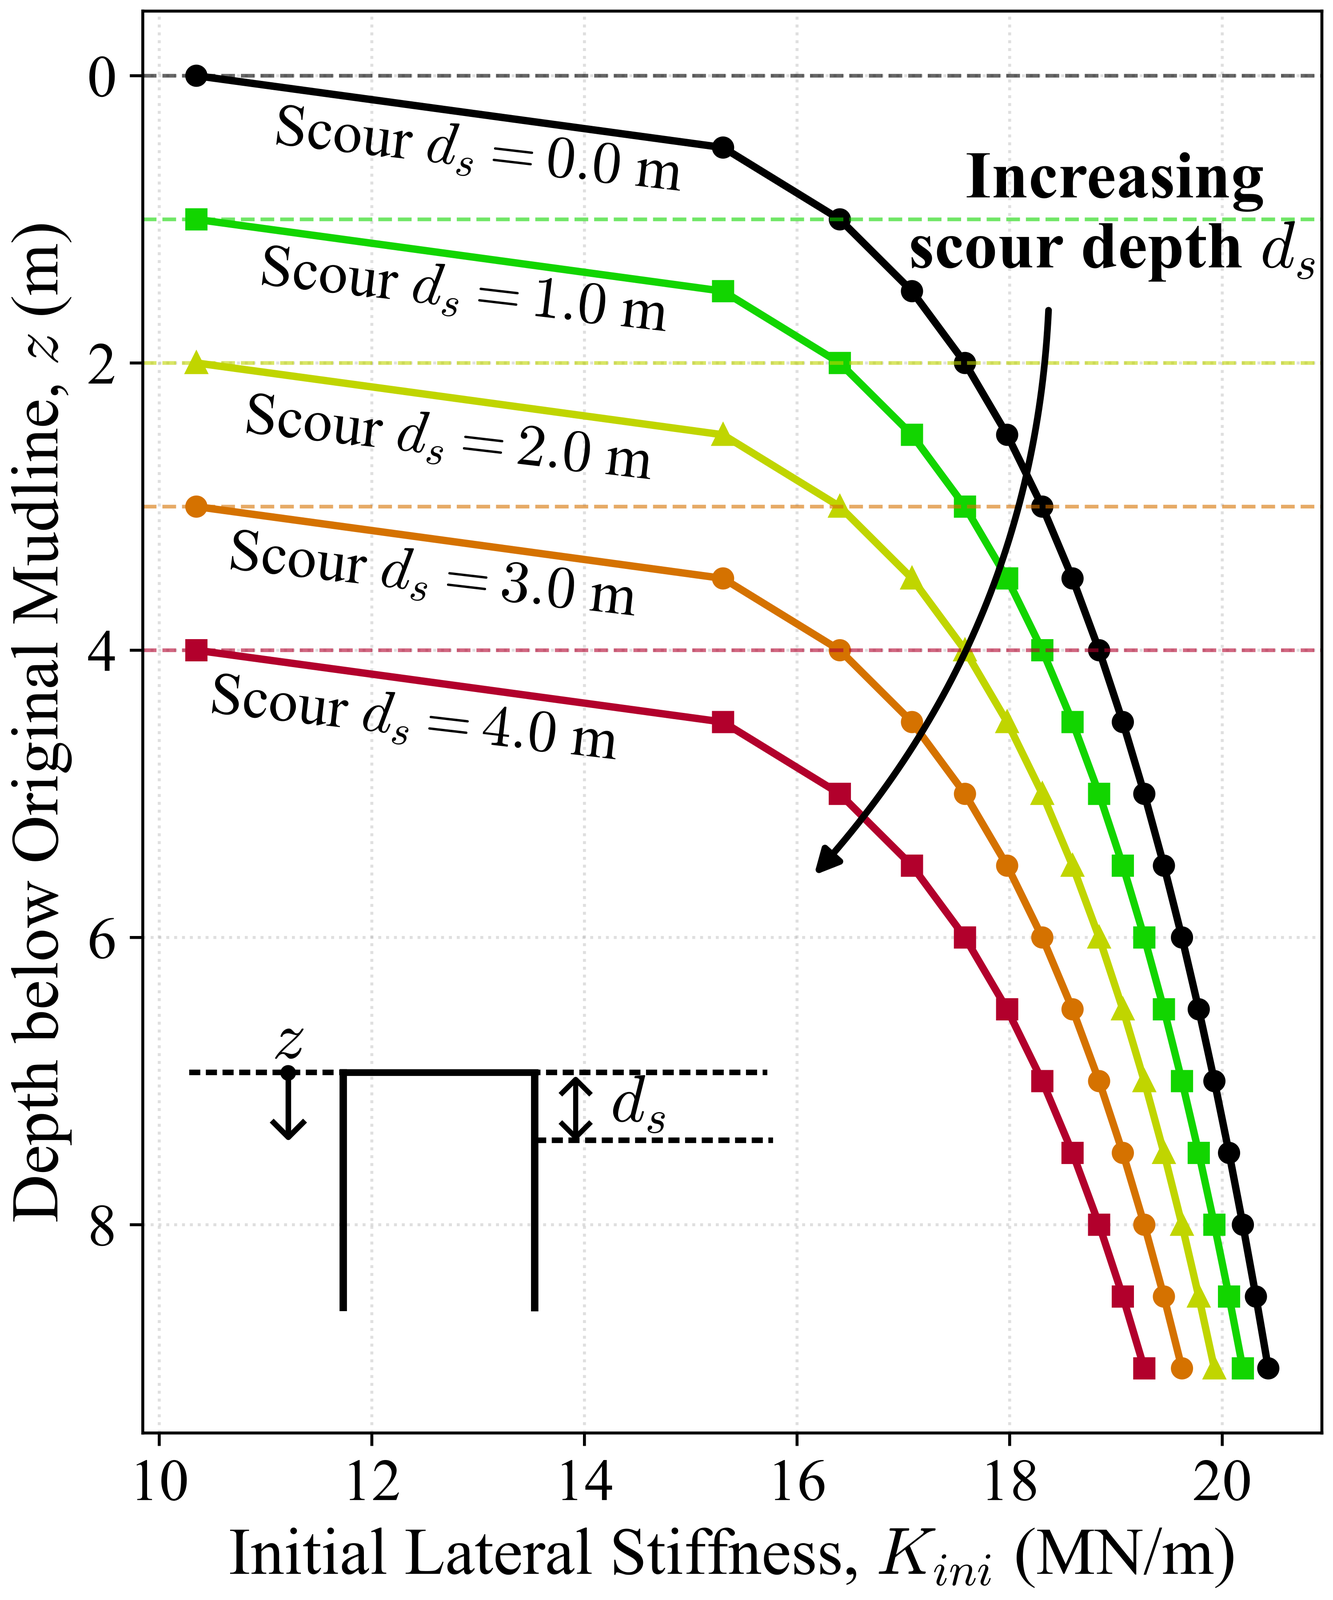
Figure 10: Scour-Induced Stiffness Evolution: Lateral stiffness profiles for scour depths 0.0–4.0 m. The leftward shift of the curves from baseline (black) to severe scour (red) represents the systematic reduction in soil stiffness as effective stress decreases with overburden removal. The shaded region indicates the removed soil layer for each scour case.
Quantifying this effect reveals its significance for structural health monitoring (SHM): at a scour depth of 4.0 m, soil situated at an original absolute depth of 5.0 m retains only 45% of its baseline initial lateral stiffness (\(K_{ini}\)). This stress-induced softening accounts for approximately 18% of the total predicted natural frequency loss—a critical delta that empirical truncation-only models fail to capture. The nonlinear trajectory of these profiles confirms that foundation degradation is not merely a surface phenomenon but a volumetric softening of the supporting soil mass.
VH Capacity Degradation and Failure Envelope Contraction
The evolution of foundation stability under progressive scour is characterized by a systematic contraction of the \(VH\) capacity envelopes, as illustrated in Fig. 11. This degradation exhibits a pronounced asymmetry: while vertical capacity (\(V_{ult}\)) decreases by 22% at a scour depth of 4.0 m, horizontal capacity (\(H_{ult}\)) sustains a more severe 35% reduction. This differential sensitivity is rooted in the governing load-transfer mechanisms of the suction bucket; lateral resistance is primarily mobilized through passive soil wedges along the skirt—a mechanism that scales directly with embedded length—whereas vertical capacity is partially buffered by the lid-bearing contribution, which remains comparatively stable despite surface erosion. The VH capacity envelopes demonstrate systematic capacity reduction with scour, with horizontal capacity degrading faster than vertical capacity.
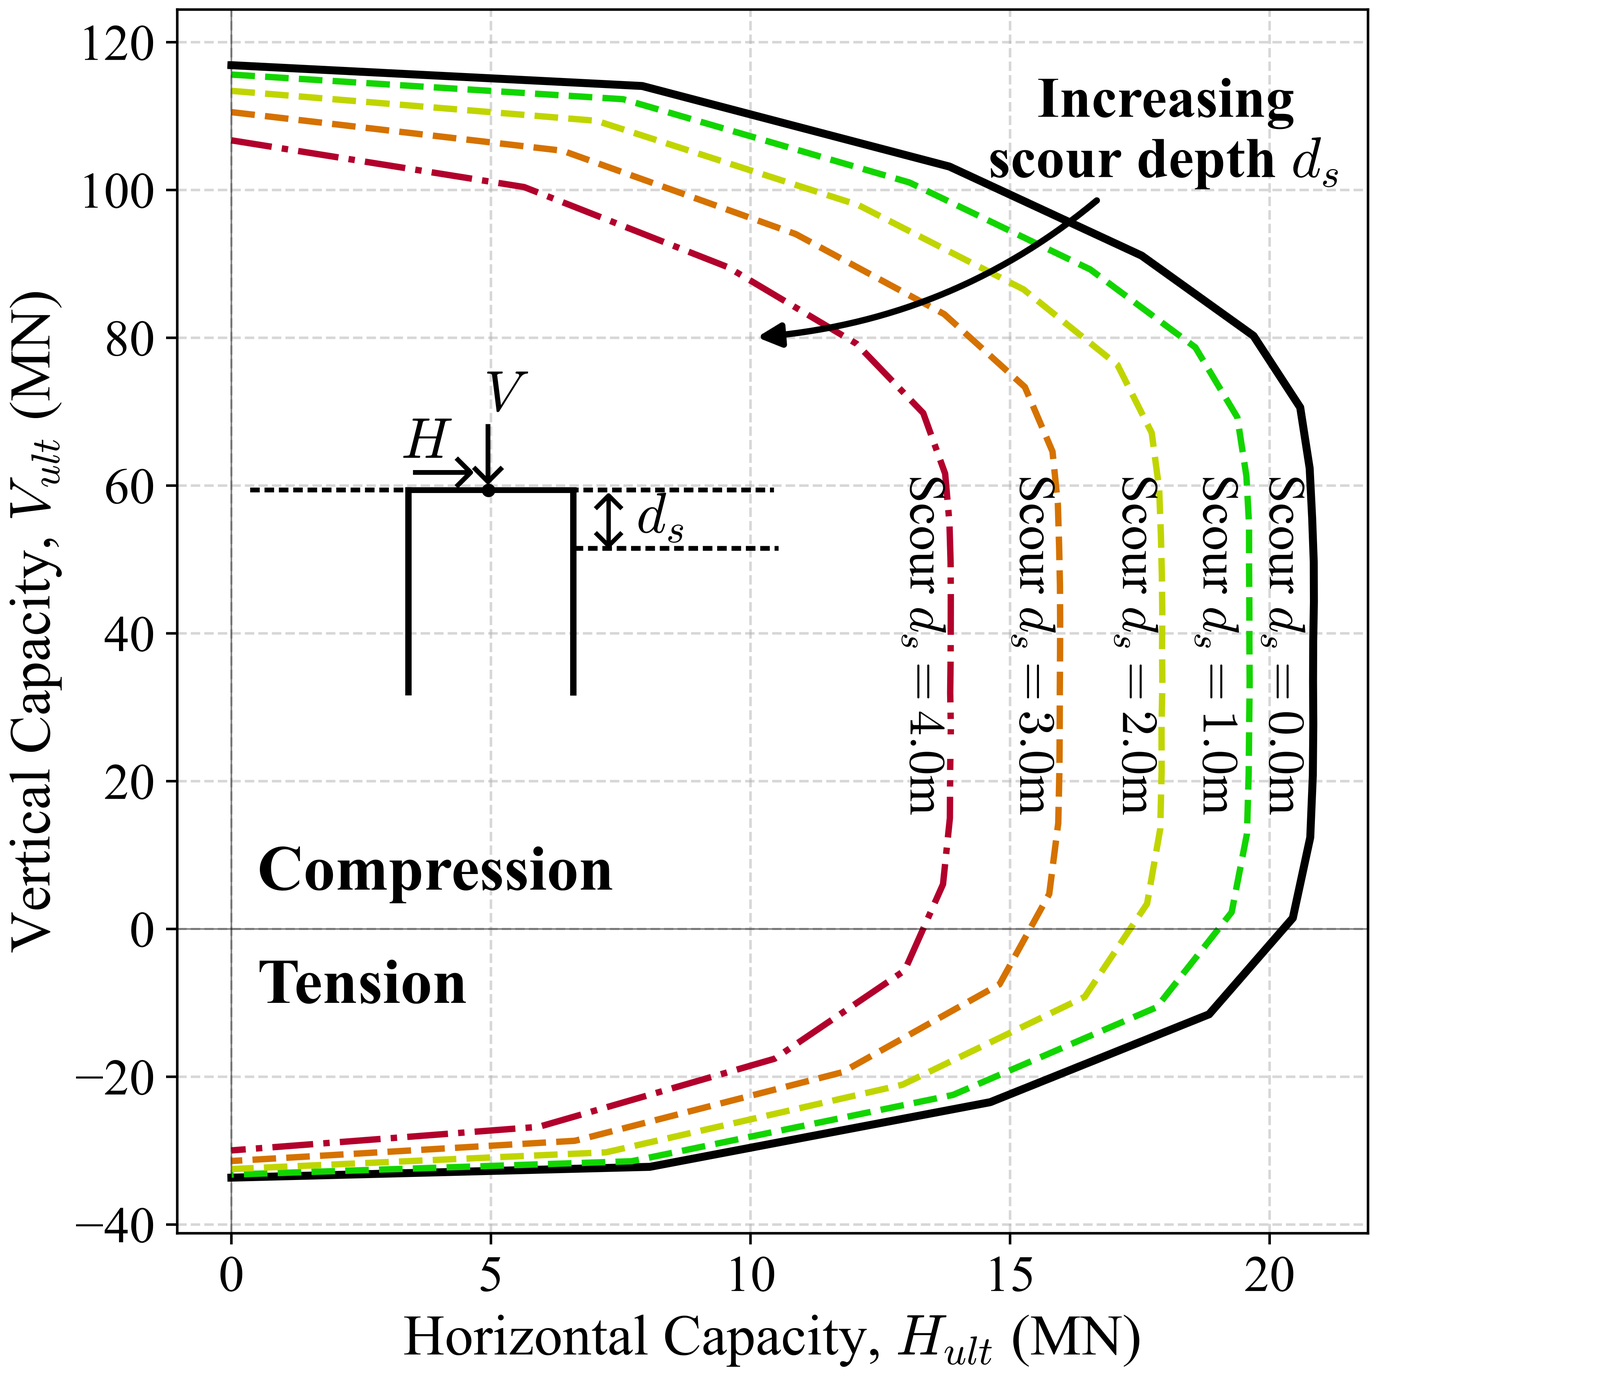
Figure 11: VH Capacity Degradation: Failure envelopes for scour depths 0.0–4.0 m. The envelope contraction is asymmetric: horizontal capacity decreases by 35% at 4 m scour while vertical capacity decreases by 22%, reflecting the differential sensitivity of lateral versus bearing mechanisms to embedment loss.
The progressive shift in the \(V/H\) capacity ratio, detailed in Table 6, signifies a fundamental migration in the system’s failure mode. As the foundation loses embedment, the governing kinematics transition from a deep rotational failure controlled by moment equilibrium toward a shallow translational failure dominated by direct sliding resistance. This mechanism migration confirms that scour does not merely reduce the magnitude of support but qualitatively alters the structural stability regime of the tripod system. The increasing vertical-to-horizontal capacity ratio indicates mechanism migration from deep rotational failure controlled by moment equilibrium toward shallow translational failure controlled by direct sliding resistance.
Table 6: VH Capacity Evolution with Scour and V/H Ratio
| Scour (m) | \(H_{\text{ult}}\) (kN) | \(V_{\text{ult}}\) (kN) | \(V/H\) Ratio |
|---|---|---|---|
| 0.0 | 4,250 | 6,820 | 1.60 |
| 2.0 | 3,520 | 6,120 | 1.74 |
| 4.0 | 2,750 | 5,340 | 1.94 |
Validation Against Centrifuge Data
The numerical framework was validated against a series of geotechnical centrifuge model tests conducted at 70g (1:70 geometric scale). Experimental details are described in [29]. The centrifuge experiments accurately replicated the prototype 4.2 MW Gunsan offshore wind turbine geometry and target soil conditions. Centrifuge testing provides a robust validation benchmark by simulating prototype-scale stress states while maintaining strictly controlled boundary conditions and well-characterized soil properties.
Detailed centrifuge results across varying soil conditions and progressive scour depths (\(S/D\) up to 0.6) demonstrate a consistent reduction in the first natural frequency. This validation is critical as centrifuge modeling eliminates the environmental variability and installation uncertainty inherent in field data. In addition, previous investigation on tripod suction bucket foundations has established that their failure and dynamic response are governed by rigid-body rotation and complex soil resistance mechanisms [30]. Specifically, passive resistance in leading buckets and tension in trailing buckets are fundamentally different from monopile behavior. Therefore, specific considerations for the TSB foundations are needed.
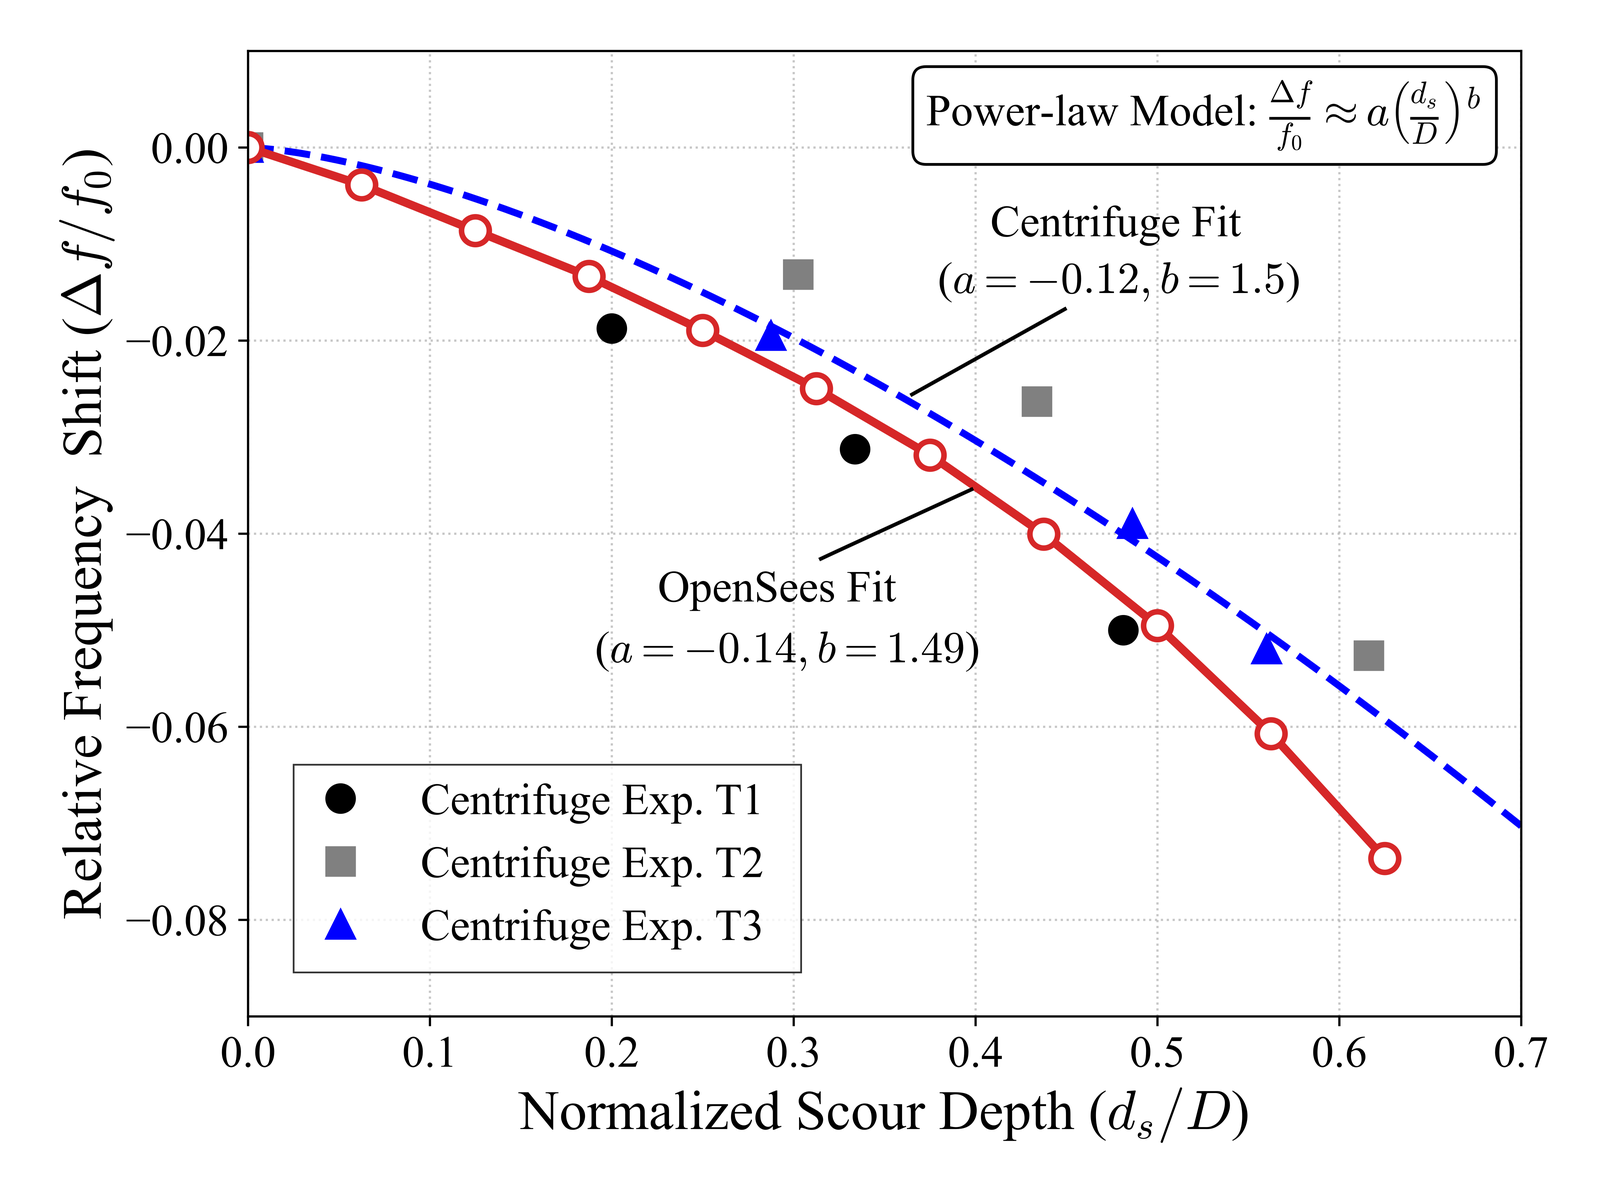
Figure 12: Baseline Validation: Centrifuge experiment data versus model predictions showing first-mode natural frequency across foundation scales
Field Validation
The centrifuge tests established accuracy under controlled laboratory conditions; the next step is validation against an operating turbine where soil variability, installation effects, and environmental loading introduce additional uncertainty. The Korea Institute of Energy Research (KIER) conducted ambient vibration testing of the Gunsan 4.2 MW offshore wind turbine over a 27-month monitoring campaign. We use their reported baseline frequency to validate the numerical model:
This benchmark frequency was extracted using Stochastic Subspace Identification from operational acceleration records. While the present paper focuses on framework development and validation, a companion publication in preparation will detail the processing methodology applied to the raw acceleration and strain time-series, including uncertainty quantification and modal parameter confidence intervals.
Table 7: Model Validation with Field Measurement (No Scour Assumption)
| Metric | Value |
|---|---|
| Field Measurement \(f_0^{\text{field}}\) | 0.2400 Hz |
| Model Prediction \(f_0^{\text{model}}\) | 0.2322 Hz |
| Absolute Error | 0.0078 Hz |
| Relative Error | −3.3% |
The framework’s underprediction of natural frequency across various foundation scales, with a tight scatter of ±2%, suggests a systematic conservative bias. This bias likely originates from the Tresca constitutive model’s inability to capture small-strain stiffness enhancement, rather than numerical artifacts. However, such underprediction is operationally advantageous for Structural Health Monitoring (SHM), ensuring that any frequency shifts detected below the model’s baseline are treated as actual structural degradation.
Comparative Analysis of Modeling Approaches
To evaluate the efficacy of the proposed Distributed BNWF framework, four distinct foundation modeling strategies were implemented using the 4.2 MW Gunsan offshore wind turbine geometry and benchmarked against the field-measured natural frequency (\(f_0^{\text{field}}=0.2400\) Hz).
Fixed Base (+7.0% error): This approach assumes infinite foundation stiffness, which inherently overpredicts the natural frequency. While a simplified tower representation might coincidentally underpredict the frequency—leading to a seemingly low baseline error through bias cancellation—the model possesses zero sensitivity to foundation degradation. Such a static +7.0% error is operationally inferior to a model that accurately tracks the trajectory of degradation.
Macro-Element (+5.0% error): By condensing foundation compliance into a lumped 6×6 stiffness matrix at a single reference node, this model captures global flexibility but lacks depth-dependency. Consequently, each scour increment necessitates manual recalibration, making it impractical for continuous monitoring, particularly under differential scour conditions across the tripod footprint.
Conventional BNWF (+5.5% error): Utilizing site CPT data and DNV guidelines, this model distributes springs along a single central axis. Although it achieves moderate baseline accuracy, the uniform stiffness assumption fails to capture the depth-weighted profile and circumferential load redistribution essential for tripod resilience.
Distributed BNWF (−3.3% error): The proposed framework preserves both the radial geometry and the depth-varying stiffness identified through Fourier extraction. By satisfying the integral energy constraint of the 3D continuum, it provides full predictive capability across the scour envelope, identifying a 6.1% frequency degradation at 4.5 m of scour.
Table 8 contrasts the performance and physics of these modeling approaches:
Table 8: Comparison of Scour Sensitivity of Natural Frequency for Different Foundation Models
| Foundation Model | \(f_0\) (Hz) | Error | SSI Physics | Scour Sensitivity |
|---|---|---|---|---|
| Fixed Base | 0.2568 | +7.0% | None (infinite Stiffness) | None |
| Macro-Element | 0.2520 | +5.0% | Lumped 6x6 Stiffness Matrix | Limited |
| BNWF | 0.2532 | +5.5% | Distributed (uniform) | Partial |
| Distributed BNWF | 0.2322 | −3.3% | Full distributed | 6.1% at 4.5 m |
Fig. 9 illustrates these foundation model distinctions. While the Fixed Base and Macro-Element models simplify or ignore foundation degrees of freedom, the Distributed BNWF model is unique in its ability to represent the high-fidelity soil-structure interaction required for reliable structural health monitoring.
Scour Sensitivity of Natural Frequency
The relationship between progressive scour and modal response is illustrated in Fig. 13, which maps the degradation state (scour depth, \(d_s\)) against the observable structural response. The resulting degradation trajectory is characteristically nonlinear: initial scour produces marginal shifts, followed by an accelerating frequency drop that reflects the underlying power-law soil stiffness profile. This nonlinearity is a critical driver for Structural Health Monitoring (SHM), as it indicates that operational safety margins are consumed at an increasing rate as erosion deepens.
As detailed in Table 9, a severe scour depth of 4.5 m—representing a 48% loss in foundation embedment—results in a 6.1% reduction from the baseline natural frequency. While this reflects the inherent structural resilience of the tripod system, the dynamic implications are significant. At this stage, the predicted frequency of \(0.2181\)~Hz crosses below the \(0.22\)~Hz 1P boundary, which corresponds to the rated rotor speed of \(13.2\)~RPM. Entering this Resonance Risk Zone leads to a dramatic increase in dynamic amplification factors, exposing the turbine to accelerated fatigue damage and potential structural instability.

Figure 13: Structural Health Monitoring Alert Thresholds: Frequency degradation trajectory versus 1P proximity showing operational safety margins. The 4.5 m scour case (orange marker) approaches the red boundary where dynamic amplification factors increase dramatically.
Table 9: Scour Sensitivity Results with Shift from Baseline
| Scour (m) | \(S/D\) | \(f_0\) (Hz) | Shift from Baseline | \(L_{\text{eff}}/D\) |
|---|---|---|---|---|
| 0.0 | 0.00 | 0.2322 | Baseline | 1.16 |
| 0.5 | 0.06 | 0.2313 | −0.4% | 1.10 |
| 1.0 | 0.13 | 0.2302 | −0.9% | 1.04 |
| 1.5 | 0.19 | 0.2291 | −1.3% | 0.98 |
| 2.0 | 0.25 | 0.2278 | −1.9% | 0.91 |
| 2.5 | 0.31 | 0.2264 | −2.5% | 0.85 |
| 3.0 | 0.38 | 0.2248 | −3.2% | 0.79 |
| 3.5 | 0.44 | 0.2229 | −4.0% | 0.73 |
| 4.0 | 0.50 | 0.2207 | −5.0% | 0.66 |
| 4.5 | 0.56 | 0.2181 | −6.1% | 0.60 |
| 5.0 | 0.63 | 0.2151 | −7.4% | 0.53 |
Discussion
Engineering Analysis of Inherent Resilience
The numerical results reveal a striking disproportion in system sensitivity: a 48% loss in foundation embedment produces only a 6.1% degradation in the fundamental natural frequency. This reduction factor indicates that the system possesses significant inherent resilience against scour. While the 3D finite element model captures these effects implicitly, their individual contributions remain obscured within the continuum solution. The following analysis decomposes this aggregate response into constituent geotechnical, structural, and systemic mechanisms to explain this resilience.
The natural frequency ratio under scour may be written as follows:
The primary mechanism for frequency stability lies in the series stiffness combination of the OWT system:
For the 4.2 MW Gunsan turbine, the tower is substantially more flexible (\(K_{\text{tower,eff}} \approx 2.8 \times 10^7\) N/m) than the foundation (\(K_{\text{found,eff}} \approx 8.2 \times 10^7\) N/m). Consequently, the tower contributes approximately 74% of the total system compliance at baseline. This stiffness part ensures that even a 52% reduction in foundation stiffness only translates to a 22% reduction in system stiffness.
This explains why Fixed Base models appear coincidentally accurate at baseline (\(+7.0\%\) error); they artificially eliminate the foundation’s compliance entirely. While this might match a single data point through fortuitous bias cancellation, such models exhibit zero sensitivity to scour and provide no mechanism for tracking actual degradation.
A secondary compensating mechanism involves the concurrent reduction of effective mass as scour progresses. As scour removes embedment, the entrapped soil plug mass—a significant portion of the foundation’s dynamic inertia—decreases from 887 to 461 tonnes. The resulting mass retention factor (\(\eta_M = 0.844\)) serves as a partial offset in the frequency equation: the system requires less stiffness to maintain a stable frequency because it is vibrating with less mass.
While a single-degree-of-freedom (SDOF) decomposition (Eq. 24) predicts a 3.9% frequency shift, the full 3D-to-1D framework observes a 6.1% shift. This 2.2% difference highlights the limitations of simplified diagnostic models. The high-fidelity framework captures two critical second-order effects:
-
Rotational Stiffness Degradation: Scour significantly reduces the moment-rotation (\(M-\theta\)) capacity at the bucket-jacket connection, which accelerates modal degradation faster than lateral stiffness loss alone.
-
\(P-\Delta\) Amplification: The increase in effective lever arm (\(H_{tower} + d_s\)) due to mudline retreat amplifies the gravitational overturning moment, further softening the effective system stiffness.
Table 10 summarizes the sequential contributions of these factors to the final observed frequency shift.
Table 10: Retention Factor Decomposition
| Factor | Symbol | Value | Mechanism |
|---|---|---|---|
| Geotechnical | \(\eta_K\) | 0.328 | Power-law profile concentrates stiffness at depth |
| Geometric | \(\Gamma\) | 0.78 | Tripod moment arm stability |
| Mass | \(\eta_M\) | 0.844 | Plug mass reduction (compensating) |
| Systemic | \(\kappa\) | 2.9 | Tower compliance dominates series combination |
| Combined | \(f_0(d_s)/f_0(0)\) | 0.939 | Multiplicative interaction (observed 6.1% shift) |
SHM Alert Thresholds and Scour Depth Inference
The sensitivity relationship derived from the eleven-scenario parametric study (\(R^2 = 0.99\)) quantifies the trajectory of system degradation:
The exponent of 1.4921 indicates a significant geometric non-linearity; while early-stage scour produces negligible frequency shifts, the rate of degradation accelerates as the mudline retreats into deeper, stiffer soil layers. This can be illustrated as the depth-dependent stiffness profile (\(z^{0.72}\)) identified in the geotechnical analysis.
By inverting this power-law relationship, the framework functions as a physics-based estimator for underwater asset conditions. Asset managers such as KEPCO engineers can map observable frequency shifts to a specific hidden degradation state (scour depth) without requiring diver inspections or bathymetric surveys:
This inversion transforms standard accelerometer data into a continuous surveillance tool, effectively translating dynamic response into a proxy for foundation embedment.
The alert thresholds in Table 11 are derived from the 1P resonance boundary rather than arbitrary empirical safety factors. For the 4.2~MW Gunsan turbine with rated rotor speed of \(13.2\)~RPM, the critical 1P excitation threshold is \(0.22\)~Hz.
As scour progresses, the system natural frequency decreases toward and eventually crosses below this boundary; at 4.5~m scour, the predicted frequency of \(0.2181\)~Hz violates the \(0.22\)~Hz limit. Once crossed, dynamic amplification factors increase catastrophically, and the structure enters the forbidden zone where rotor-induced fatigue damage accelerates by orders of magnitude.
Table 11: Risk-Informed SHM Operational Thresholds
| Alert Level | Frequency Shift | Inferred Scour | 1P Margin | Rationale |
|---|---|---|---|---|
| GREEN | \(< 3\%\) | \(< 2.5\) m | \(> 5\%\) | Inherent resilience regime |
| YELLOW | \(3\)–\(5\%\) | \(2.5\)–\(3.5\) m | \(3\)–\(5\%\) | Approaching dynamic limit |
| ORANGE | \(5\)–\(7\%\) | \(3.5\)–\(4.13\) m | \(1\)–\(3\%\) | Immediate intervention |
| RED | \(> 7\%\) | \(> 4.13\) m | \(< 1\%\) | 1P proximity critical |
As shown in Fig. 14, the system natural frequency crosses this boundary at a scour depth of 4.13 m. Beyond this limit, dynamic amplification factors increase exponentially, shifting the structure into a regime where rotor-induced fatigue damage accelerates catastrophically.
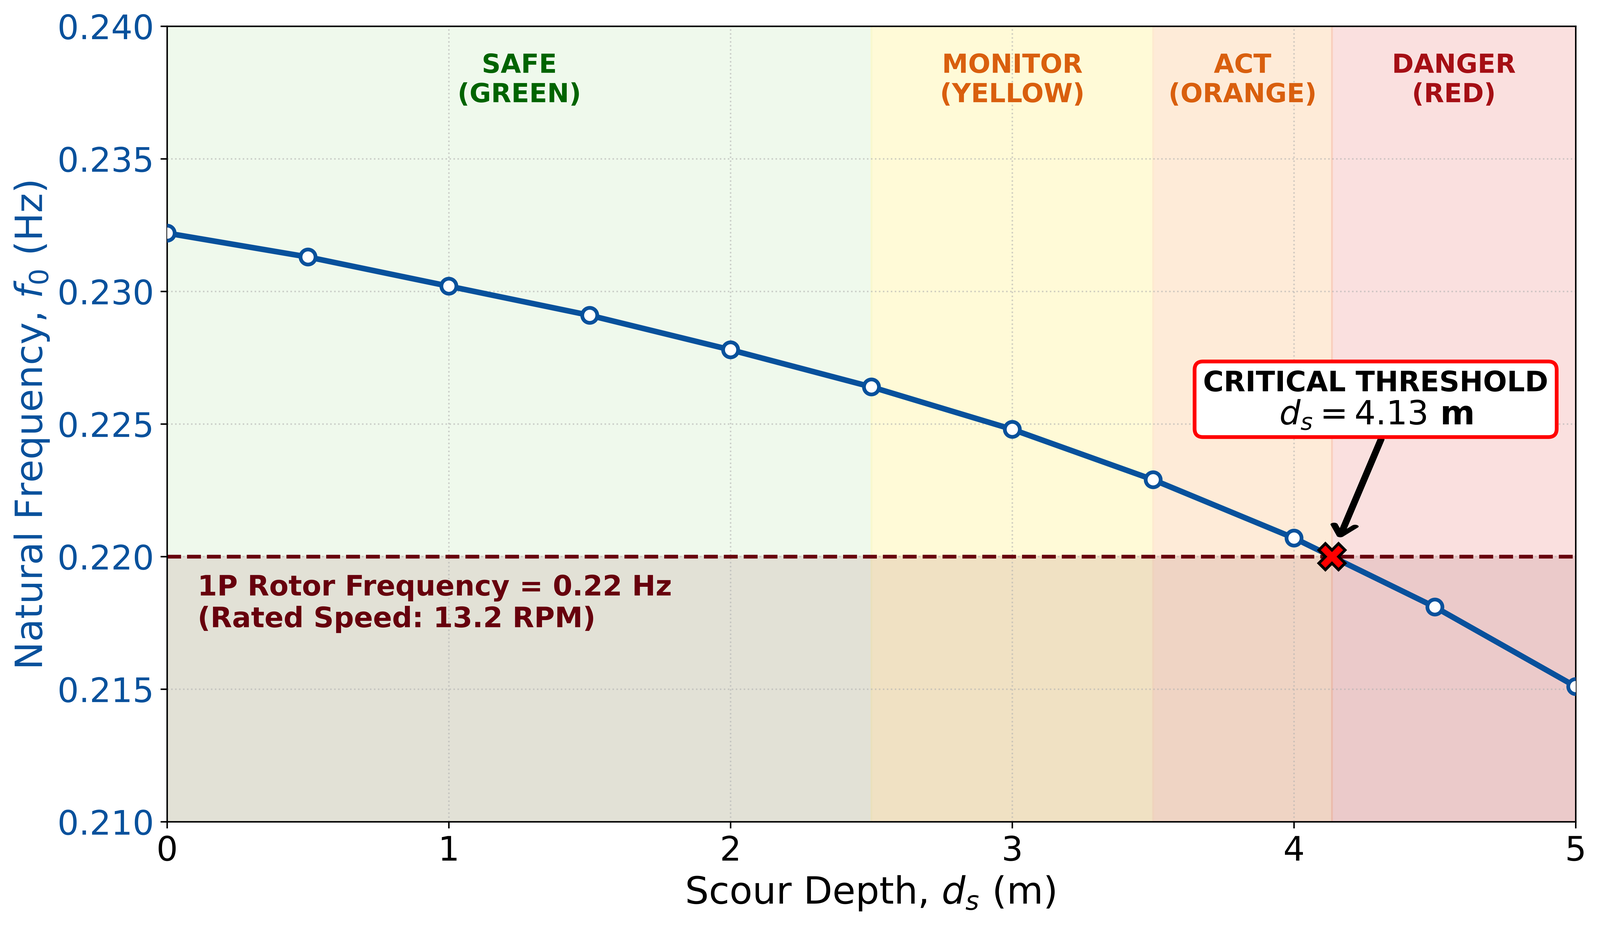
Figure 14: SHM Alert Framework: Risk-informed operational thresholds overlaid on frequency degradation trajectory. The intersection with the 1P boundary at 4.13 m defines the operational RED limit, while the validation envelope extends to 4.5 m (48% embedment loss), demonstrating accuracy across the full scour range.
This reduction factor explains the relative stability of the “Green” regime (where 27% embedment loss yields only a 3% shift). However, the narrow margin between “Orange” and “Red” (approximately 0.6 m) demonstrates that safety margins are depleted rapidly once the 1P boundary is approached.
Methodologically, this underscores why Fixed-Base or traditional calibration approaches are operationally risky and may be hazardous. A model that matches a single field measurement through bias cancellation such as ignoring foundation compliance while overestimating tower mass cannot capture the non-linear sensitivity of the true OWT system. Only a framework that explicitly maps the stress-dependent stiffness evolution of the soil can provide reliable predictive capability across the entire asset lifecycle.
Effective Stress Reduction
The inherent resilience of the tripod suction bucket foundation originates from the soil’s intrinsic stress-stiffness relationship, where stiffness in normally consolidated marine clays concentrates at depth following a power-law profile. The extracted exponent of \(B = 0.72\) reflects a hybrid mechanical signature: it is intermediate between the shallow footing regime (\(B \approx 0\)) and slender pile behavior (\(B \approx 1\)), demonstrating the coupled lid-bearing and skirt-friction mechanisms unique to bucket foundations with an aspect ratio near unity. This power-law distribution provides engineering insight: shallow scour primarily removes the softest upper soil layers while the stiffer, deep-seated soil remains engaged. However, this advantage is partially countered by the reduction in effective stress experienced by the remaining soil as the overburden is removed.
The net result of these competing mechanisms can be quantified by the stiffness retention factor, \(\eta_K\):
For a severe scour depth of 4.5 m (48% embedment loss), numerical integration yields a retention factor of 0.328, indicating a 67.2% stiffness loss at the individual bucket level. While the framework’s predictive fidelity is validated up to this extreme limit, achieving a natural frequency degradation of only 6.1%, this physical robustness must not be conflated with operational safety.
The true constraint for asset management is the dynamic margin—the gap between the system’s natural frequency and the 1P rotor excitation band. As visualized by the curve in Fig. 14, the operational fatigue limit is reached at a scour depth of 4.13 m, where the frequency first intersects the 0.22 Hz 1P boundary. At this critical threshold, the foundation retains 60% of its physical embedment, yet the structure enters a resonance risk zone, where resonance-induced fatigue damage accelerates by orders of magnitude. This distinction between physically resilient foundations and dynamically constrained operations is the conceptual core of the proposed SHM alert framework.
Conclusions
This study established a 3D-to-1D numerical framework that bridges high-fidelity geotechnical analysis and real-time structural health monitoring for offshore wind turbine (OWT) tripod bucket foundations. By mapping depth-varying stiffness profiles from 3D continuum models to 1D distributed Winkler springs, the framework preserves energy consistency. Principal findings of this study are summarized as follows:
-
The 4.2 MW Gunsan offshore wind turbine demonstrates significant physical resilience; a 4.5 m scour depth (48% embedment loss) results in only a 6.1% degradation in natural frequency. This resilience is governed by the system’s series stiffness, where the flexible tower provides approximately 74% of total compliance.
-
Despite physical stability, the operational fatigue limit is reached at a scour depth of 4.13~m. At this threshold, the natural frequency drops to \(0.22\)~Hz, intersecting the 1P rotor excitation frequency (corresponding to the rated rotor speed of \(13.2\)~RPM) and initiating a regime of accelerated fatigue damage.
-
The power-law exponent of \(B = 0.72\) serves as the unique mechanical fingerprint for the Gunsan site, reflecting the hybrid load-transfer mechanism of suction bucket foundations in site-specific soil (normally consolidated marine clay).
-
The framework achieved a baseline frequency prediction error of only \(-3.3\%\) compared to field-measured values. This systematic underprediction is attributed to the Tresca model’s conservative treatment of small-strain stiffness.
Although this study’s framework effectively captures accurate scour sensitivity of the OWT system’s natural frequency, the current global scour assumption needs further verification. Future research should extend this methodology to asymmetric local scour patterns and incorporate Hardening Soil Small-Strain models to further refine predictive fidelity in the small-strain regime. This 3D-to-1D workflow provides the technical foundation for transitioning from reactive underwater inspections to data-driven, condition-based asset management. Also, while this framework provides a robust baseline, its current validation is centered on the 4.2 MW Gunsan turbine in normally consolidated marine clay. Scaling these insights to 10 MW turbines, diverse soil strata, or alternative foundations like monopiles will require expanded validation to ensure the physics holds at higher magnitudes.
By combining a conservative validation error of \(-3.3\%\) with a computational speed that turns hours of FEA into seconds of eigenvalue analysis, this methodology bridges the gap between the lab and the field. It provides a scalable, technical foundation for the entire asset lifecycle, enabling a long-overdue transition from reactive maintenance to condition-based management.
Acknowledgments
This research was supported by Korea Electric Power Corporation (R23XO05-01), National Research Foundation of Korea Mid-Career Researcher Program (NRF-2022R1A2C2009260), Korea Institute of Marine Science & Technology Promotion (RS-2025-02304428), BK21 FOUR funded by Ministry of Education, and Korea Institute of Energy Technology Evaluation and Planning (RS-2025-02318006). The authors gratefully acknowledge the Korea Institute of Energy Research (KIER) for providing the field monitoring data used for validation.
Data Availability
The computational implementation, processed stiffness profiles, and structural model files are available from the corresponding author upon reasonable request.
CRediT Author Contributions
Kyeong Sun Kim: Conceptualization, Methodology, Software, Validation, Formal analysis, Investigation, Writing - Original Draft, Visualization. Seong Ho Hong: Resources, Data Curation, Writing - Review & Editing. Sung Ryul Kim: Conceptualization, Supervision, Project administration, Funding acquisition, Writing - Review & Editing.
Declaration of Competing Interests
The authors declare no known competing financial interests or personal relationships that could have appeared to influence the work reported in this paper.