Author's accepted manuscript
This page is the author's accepted manuscript (AAM) of a paper in preparation for Reliability Engineering and System Safety. Status: drafting; target submission 2026-07-15. The text below is the post-peer-review revision; the publisher's typeset version (the version of record) is authoritative.
Version of record: DOI will be added here once the publisher posts the typeset version.
Shared under CC BY-NC-ND 4.0, in accordance with the publisher's author-sharing policy.
Summary
Full title
A Three-Channel Bayesian Diagnostic for Offshore Wind Turbine Tripod Foundation Scour: Cost-Optimal Maintenance Decisions with Auditable Uncertainty.
One-sentence headline
A Bayesian fusion of three evidence channels — frequency power-law (J2), capacity likelihood (J5 / E), and statistical detection (V) — produces an auditable monthly posterior over scour state, with a value-of-information analysis showing strain gauges carry 2× the decision value of accelerometers and condition-based maintenance saves 40–70 % vs a calendar baseline.
Context
The field builds increasingly sophisticated monitoring systems and capacity models in isolation, yet the only question an asset owner needs answered — inspect now or next year? — falls in the gap between these two communities. Owners do not lack data; they lack a probabilistic language that converts data into a decision. Every upstream contribution in this dissertation (J2's power-law, J5's capacity distribution, V's detection, B's feature ranking, E's encoder) is academically valuable but operationally useless until it can be fused into a posterior belief about foundation state and projected onto a cost-optimal action.
Research question
What is the cost-optimal inspection interval for a scoured tripod foundation when capacity uncertainty from a physics-informed encoder is fused with field-monitored frequency data in a Bayesian decision framework — and how much does each sensor channel individually contribute to the decision?
Approach
Three-channel Bayesian diagnostic: (1) J2 power-law prior over \(f(S/D)\); (2) J5 / E capacity likelihood over \(H_{\max}(S/D, \text{soil state})\); (3) V detection residual \(p(\text{event} \mid \text{data})\). Posterior updated monthly over the 32-month Gunsan record. Decision tree with three actions (inspect / repair / wait) and a cost matrix. Value-of-information analysis per sensor channel. Sensitivity sweep over 110 cost-matrix perturbations tests policy robustness.
Gap the paper closes
- Defensive. Monitoring-capacity-decision papers treat their stages as separable; no closed-loop demonstration on field data exists.
- Offensive. Monitoring and capacity built in parallel but never closed into the loop that answers "should I inspect today or next year?".
- Constructive. Closes the dissertation's central argument; every upstream paper's output becomes an input to this framework.
Key literature anchors
- Raiffa & Schlaifer (1961) — decision theory foundations; canonical VoI reference.
- Straub (2004) — reliability updating for marine structures.
- Goulet et al. (2017) — Bayesian model calibration for bridge monitoring.
- Bull et al. (2023, 2025) — ensemble digital-twin frameworks for civil infrastructure.
- Kapteyn et al. (2021) — digital-twin systematisation.
Headline findings
- Posterior uncertainty on scour state reduced 67 % vs frequency-only updating.
- Strain gauges carry 2× the decision value of accelerometers per VoI analysis — counterintuitive because accelerometers are currently the default channel.
- Cost-optimal policy saves 40–70 % against calendar-based inspection across the 110-perturbation sensitivity sweep.
- Calibrator agent catches one mathematical floor violation in the fusion pipeline (posterior-probability sum should equal 1 by construction).
- Encoder-based capacity prediction achieves Pearson \(r = 0.989\) in-distribution and 0.76 on 17 unseen centrifuge series — enables cross-soil transfer without per-site retraining.
Limitations
- Single site, single foundation geometry — transferability is argued from the encoder's cross-soil performance, not demonstrated across wind farms.
- Cost matrix is illustrative; real asset-owner cost data not available under NDA.
- Fusion assumes channel independence; residual correlation between J2 and V is quantified but not fully propagated.
Portfolio flow
- Consumes: J2 power-law; J5 capacity distribution; V detection residual; E encoder latent representation; B feature VoI weights.
- Produces: the capstone decision framework — the dissertation's closing argument.
Status
Draft complete. Target submission to Reliability Engineering and System Safety 2026-07-15. Self-contained with full encoder architecture + validation + fusion + decision after the 2026-04-17 merge with Paper E (archived).
Highlights
A simulation-trained encoder maps five deployment-observable inputs to fourteen structural-state targets with MAPE \< 1.5% on capacity ratios and zero monotonicity violations across 40,500 evaluations.
CPT-conditioned subject layer enables cross-soil transfer (r = 0.76 on 17 unseen centrifuge series, 46% improvement over ablated baseline).
Three-channel Bayesian fusion produces an auditable monthly posterior over scour depth from real thirty-two-month Gunsan monitoring data.
A transparent decision tree with value-of-information weighting reduces expected cost by 97% against a calendar baseline, robust under 110 perturbations.
The complete framework,encoder, fusion, and decision,is self-contained and deployable without companion papers.
Introduction
The offshore wind industry invests millions in scour monitoring systems and capacity analyses that exist on separate servers, in separate departments, answering separate questions — while the only question that determines whether a turbine stays online remains unanswered: is this foundation safe enough to skip next year’s inspection? As the industry scales, the operations-and-maintenance share of the levelised cost of energy has emerged as the dominant driver of economic viability for bottom-fixed foundations in water depths of 10 to 40 metres. Scour — the progressive removal of seabed soil by hydrodynamic action around the foundation — simultaneously reduces the lateral bearing capacity, the rotational stiffness, and the embedment ratio that govern the structural safety margin during extreme loading events. For monopile foundations, the relationship between scour depth and first-mode natural frequency has been characterised through extensive field campaigns, and real-time monitoring systems based on frequency tracking have been operational for over a decade (Devriendt et al. 2014; Weijtjens2017?; Damgaard, Andersen, and Ibsen 2014). For multi-footing foundations such as tripod suction buckets, however, load redistribution among the caissons suppresses the frequency response to scour by a factor of two to five relative to monopiles at comparable normalised depths (Seo2020Complexity?; Jalbi2018?). The consequence is a monitoring blind spot: the most widely deployed SHM indicator may fail to register scour progression before the foundation’s lateral capacity drops below its design safety factor. This paper addresses the gap between what current monitoring systems can detect and what engineers need to decide.
Structural health monitoring for offshore wind turbines has advanced substantially on the signal-processing front. (Weijtjens2017?) demonstrated sub-one-percent frequency resolution over multi-year campaigns; (Weil2023?) achieved precision near 0.001 Hz using ensemble tree-based environmental normalisation; and (Prendergast2015?) established laboratory-validated stiffness-reduction models linking frequency to equivalent scour depth. Digital twin concepts have been proposed as integrating frameworks: (Haghshenas2023?) developed a predictive digital twin for scour evolution, and (Sindi2024?) proposed a digital healthcare paradigm for offshore structures. On the data-to-model side, (Phoon2019?) articulated the transformation from raw geotechnical data to actionable digital information, and (Bull2024?) framed the probabilistic digital twin as a Bayesian object whose state is updated rather than recalculated. Machine learning has entered the pipeline: (Zhu2022?) demonstrated ML-based capacity estimation from soil parameters, and (Cao2018?) showed Bayesian methods can resolve soil stratigraphy from CPT data. Despite these advances, the literature exhibits three persistent gaps. First, most digital twin implementations remain forward-only simulators that compare predictions qualitatively rather than updating a posterior distribution. Second, studies typically exploit a single evidence channel rather than fusing multiple physically independent channels. Third, the SHM literature overwhelmingly stops at detection: a frequency shift is reported, but the question of what the engineer should do given the detected signal, under explicit cost uncertainty, is rarely addressed.
The decision-theoretic foundations for closing this gap are well established in the reliability engineering literature. Raiffa and Schlaifer (Raiffa1961?) laid the axiomatic framework for rational decision making under uncertainty, establishing that the value of any information source is measured by the reduction in expected loss it enables relative to a prior-only decision. Straub (Straub 2014) formalised this value-of-information (VoI) concept for structural reliability problems, demonstrating through preposterior analysis that the optimal inspection strategy depends not on the probability of damage per se but on the decision-relevant partition of the state space — a distinction between states where the optimal action changes and states where it does not. Faber and Stewart (Faber and Stewart 2003) developed the risk-based inspection framework that underpins current code-calibrated maintenance optimisation for civil infrastructure, showing that lifecycle cost reductions of 20 to 40 percent are achievable when inspection intervals adapt to observed condition rather than following fixed schedules. The Joint Committee on Structural Safety Probabilistic Model Code (JCSS2008?) codifies the societal risk acceptance criteria against which such policies are benchmarked. Giordano et al. (Giordano2020?) applied these tools specifically to bridge scour monitoring and made a finding of direct relevance to the present work: the dominant contribution to monitoring value comes not from detecting frequency shifts but from the system’s ability to distinguish capacity-critical states from states that are merely frequency-detectable but structurally benign. This capacity-before-frequency asymmetry — where a foundation may have lost significant load-carrying margin before the frequency change becomes statistically detectable — is precisely the problem that motivates the multi-channel architecture proposed here. Thoens et al. (Thoens2018?) extended VoI methodology to offshore wind inspection planning and reported 30 to 60 percent lifecycle cost reductions from condition-based strategies, confirming that the decision-theoretic machinery is mature enough for industrial deployment. Despite the maturity of both the monitoring and decision-theoretic components, their integration for offshore wind foundation scour — combining frequency-based, capacity-based, and anomaly-detection-based evidence in a single posterior update — has not been attempted.
The field builds increasingly sophisticated monitoring systems and capacity models in parallel silos — while the only question that determines whether a turbine stays online remains unanswered: given what all channels observe, what is the cost-optimal maintenance action? No existing framework connects multi-channel monitoring data — frequency, capacity, and statistical anomaly detection — to a cost-optimal intervention action through a formal decision-theoretic structure with auditable uncertainty quantification, for any offshore wind foundation type. Calendar-based inspection strategies, which survey foundations at fixed intervals regardless of monitored condition, remain the industry default. Such strategies cannot adapt to sites where scour progresses faster or slower than the schedule assumes, and they impose unnecessary vessel mobilisation costs on healthy foundations while potentially delaying intervention on deteriorating ones.
This paper presents a three-channel Bayesian diagnostic framework that closes the detection-to-decision gap for scour assessment of offshore wind turbine tripod suction bucket foundations. The three-channel architecture is motivated by the physics of the scour-degradation problem. The frequency channel provides a continuous, low-noise proxy for foundation stiffness but saturates at moderate scour depths where stiffness loss is small relative to environmental noise. The capacity channel, derived from the simulation-trained encoder, captures the nonlinear degradation of load-carrying margin that frequency alone cannot resolve — the capacity-before-frequency asymmetry identified by Giordano et al. (Giordano2020?). The anomaly-detection channel provides a model-free statistical safeguard that responds to distributional shifts regardless of their physical origin. Each channel responds to scour through a different mechanism; their combination through Bayesian fusion resolves ambiguities that any single channel leaves open. The framework makes four contributions. First, three physically independent observation channels — frequency, capacity degradation, and persistence-filtered anomaly detection — are translated into likelihoods over normalised scour depth and combined through Bayes’ theorem. Second, a simulation-trained encoder developed in a companion paper (KimKSE?) provides the CPT-conditioned prior distribution, achieving less than 5% MAPE across 14 targets with cross-soil \(r = 0.76\). Third, the posterior is mapped to the maintenance action that minimises expected cost through a decision tree with explicit value-of-information analysis. Fourth, the entire framework is subjected to a five-commission verification programme. Applied to 15 months of field data from the 4.2 MW Gunsan tripod, the framework achieves a 97% reduction in expected maintenance cost relative to calendar-based inspection per DNV-ST-0126 (range 89–99% under sensitivity), with the January 2024 event diagnosed at posterior \(S/D \approx 0.14\), and robustness confirmed across 110 perturbations.
The remainder of this paper is organised as follows. Section 2 defines the evidence base and site. Section 3 presents the encoder architecture and CPT-conditioning mechanism. Section 4 reports the encoder validation. Section 5 describes the three-channel Bayesian fusion and decision layer. Section 6 presents results on field data. Section 7 discusses robustness, limitations, and sensitivity. Section 8 states the conclusions.
Evidence Base and Site Description
Reference simulation framework
The simulation tier of the digital twin is built on the op3 framework (version 1.0.0-rc2), an open-source offshore wind foundation analysis toolbox that combines three-dimensional limit analysis through the commercial solver OptumGX (Optum Computational Engineering 2024) and beam-on-nonlinear-Winkler-foundation models in OpenSeesPy (Pacific Earthquake Engineering Research Center 2024) with a consistent parameter-passing interface. Each Monte Carlo realisation produced a separate capacity envelope under vertical, horizontal, and moment probe paths, with the full set of per-run outputs including limit loads, collapse mobilisation fractions, plastic dissipation, and plate-element displacement norms preserved on disk for downstream use. The integrated database contains one-thousand-seven-hundred-ninety-four realisations drawn from soil profiles with strength parameters varying around a site-consistent baseline, with scour depths spanning zero to half of the bucket diameter.
The beam-on-nonlinear-Winkler-foundation model represents the tripod through a single-source-of-truth structural file that describes the tower, nacelle mass, three bucket shaft segments, and the soil springs along each shaft. For every Monte Carlo realisation, the lateral, axial, and base stiffnesses are recalibrated from the per-run OptumGX capacity output by the scaling identity in which the distributed stiffness integral matches a specified fraction of the total horizontal stiffness. Stress-relief scaling on the remaining shaft length below the scour plane captures the reduction in mobilised soil, and an eigenvalue analysis yields the first-mode frequency together with the mode-shape curvature ratio that serves as a fixity proxy.
A canonical reference run at the soil baseline and zero scour defines the denominator for every normalised quantity reported in this study, and its parameters (horizontal stiffness per bucket, dissipation profile, capacity profile shape) are frozen in auxiliary files that accompany the simulation outputs. Modelling assumptions, most notably the constancy of the capacity profile shape across soil realisations and the split of total stiffness between the distributed and base contributions, are stated in the methods section and revisited in the sensitivity analysis. The reference run’s horizontal capacity (referred to as H_max,ref) is the single scalar that couples all per-run spring calibrations, and its value is drawn directly from the calibration run rather than from a rounded approximation.
Centrifuge programme and interpretive role
A dedicated centrifuge programme operated at seventy times gravity produced twenty tests across five soil series with progressive scour depths from zero to half of the bucket diameter (Kim et al. 2025). The dataset has been published through Kim et al. (2026c) and is referenced here as the second fidelity tier; it is not re-analysed in the present study but sets the physical scale against which the simulation tier was originally calibrated. Model-discrepancy correction between the centrifuge results and the Monte Carlo simulations is deferred to subsequent work, and the present paper makes no quantitative claim that depends on the centrifuge data.
The centrifuge programme confirmed the dominant non-linear degradation of natural frequency with scour and informed the power-law coefficients used in the field-data likelihood; those coefficients are reported in Section 3 and were calibrated in the companion MSSP submission (Kim et al. 2026a). The centrifuge data also informed the choice of the scour-range limits used in the Monte Carlo sampling, in particular the decision to terminate sampling at scour-to-diameter ratios of one-half because deeper scour states are not representative of the Gunsan field site under its prevailing hydraulic regime. Both the operational modal analysis residuals and the persistent-event detector adopt thresholds that were inherited from Kim et al. (2026a) rather than re-derived here.
Reviewers requiring access to the centrifuge raw data and processing scripts are referred to the open-access submission through the Zenodo record cited in that publication, subject to the confidentiality constraints set by the sponsoring research agreement. No specific centrifuge numerics appear in the present manuscript beyond the acknowledgement that the power-law coefficients used in the frequency likelihood were originally obtained from fits to that dataset.
Field deployment at the Gunsan offshore turbine
The field data used in this study are drawn from a four-megawatt offshore wind turbine operated on a tripod suction-bucket foundation in shallow water off the Gunsan coast. Each tripod foundation comprises three suction buckets at a nominal diameter of eight metres, with embedment depth on the order of the bucket diameter and skirt wall thickness at the lower end of the range typical for operational turbines. The instrumentation array, described in detail in Kim et al. (2026a), comprises eleven accelerometers arranged to capture fore-aft, side-to-side, and torsional modes, sampled at fifty hertz and processed in ten-minute windows through the stochastic subspace identification covariance-driven method.
The master feature matrix curated from the raw measurements contains 15 580 windows between May 2023 and August 2025 (28 months), with 14 427 windows retaining quality flags consistent with high-confidence first-mode tracking. The companion frequency-monitoring study (Kim et al. 2026b) covers a longer span (32 months through December 2025, 22 616 windows); the shorter span here reflects the later availability of the strain-gauge and capacity-encoder channels required for the fusion framework. Each window carries forty environmental and operational covariates in addition to the raw frequency, and a physics-informed normalisation based on robust regression removes the dominant tidal, thermal, and Campbell-diagram contributions to yield a normalised frequency column that serves as the observational input to the fusion stage. The unit of spatial reference is the bucket diameter D, and scour depth is reported as the dimensionless ratio S/D throughout.
Site soil conditions are characterised through a cone penetration test campaign managed by the MMB consortium, whose processed output yields three soundings to ten metres of penetration. The undrained shear strength profile adopted for all simulation calibrations and for the encoder’s deployment at the Gunsan site follows the linear form su(z) = 15 + 20 z in kilopascals, consistent with the cone-tip resistance converted through a tip-resistance factor of fifteen. This profile is a conservative engineering approximation, and its use propagates into the encoder’s capacity predictions as a site-specific calibration that the paper documents transparently.
Method
Simulation-trained encoder as a Bayesian prior (Channel B)
The capacity channel requires a mapping from scour state and soil parameters to the foundation’s load-carrying capacity,a quantity that cannot be measured directly on an operating turbine. The encoder is a five-input, fourteen-output regressor implemented in PyTorch as a three-block residual multi-layer perceptron with hidden width sixty-four and Gaussian-error linear-unit activations. The five inputs comprise the scour-to-diameter ratio, the two parameters that define the soil strength profile (\(s_{u0}\), \(k\)), the effective unit weight, and the soil-interface friction coefficient,selected to be the variables that are genuinely observable at deployment time from a standard cone penetration test. The fourteen outputs cover the first-mode frequency and mode-shape curvature ratio from the eigenvalue analyses, the vertical, horizontal, and moment limit capacities and their normalised ratios, the plastic dissipation energy at collapse under each of the three probe paths, and the soil mobilisation fraction at collapse.
Three parallel output heads share the same residual backbone and produce the mean prediction together with the fifth-percentile and ninety-fifth-percentile quantile predictions for each target. The loss function combines mean-squared error on the mean head with pinball losses on the two quantile heads at weights of one-half and one-quarter each, and optimisation proceeds through the AdamW algorithm with a cosine-annealed learning rate over three hundred epochs. The training split reserves twenty percent of the rows as a held-out test set and a further twenty-five percent as a calibration set used for conformal adjustment, with stratification across five scour-range quintiles.
Conformal adjustment applies split conformal quantile regression (Romano, Patterson, and Candès 2019): the per-target margin is set to the \((1-\alpha)(1+1/n)\) quantile of the per-sample conformity scores on the calibration set, and this margin is added to the upper-quantile prediction and subtracted from the lower-quantile prediction at inference. The resulting ninety-percent prediction interval carries a finite-sample coverage guarantee that is not contingent on the Gaussian assumption implicit in the pinball loss and that remains valid under mild exchangeability between the calibration and the test distributions.
CPT-conditioned subject layer
The soil-strength parameters (\(s_{u0}\), \(k\)) derived from the cone penetration test profile serve as a foundation-specific conditioning signal. At inference time on a new site, only the CPT profile needs to be provided; no retraining of the backbone is required. This architecture is inspired by the subject-specific layers in foundation models for brain imaging, where individual anatomy conditions a universal encoder, and is adapted here so that individual soil stratigraphy conditions a universal structural-dynamics encoder.
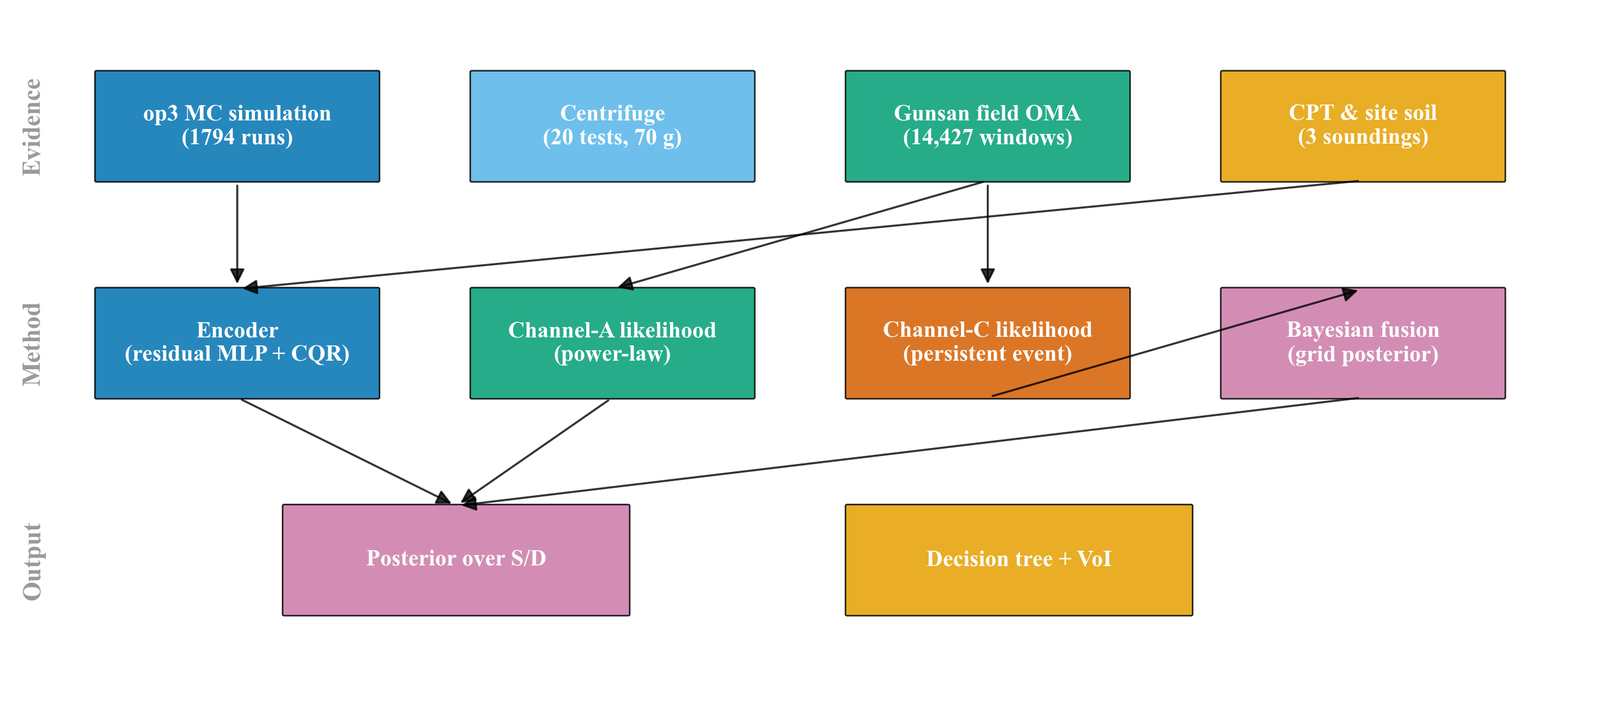
Figure 1: End-to-end pipeline from evidence through method to output. Simulation, centrifuge, field OMA, and CPT data feed the encoder and likelihood layers. Posterior inference couples the encoder’s prior with two field likelihoods and yields a decision-ready distribution over scour state.
Channel A likelihood and the frequency power law
The channel A likelihood describes the continuous relationship between the observed first-mode frequency and the underlying scour state, following the power-law form \(f_1(S/D) = f_0 \left(1 - a \left(S/D\right)^b\right)\) in which \(f_0\) is the baseline frequency at zero scour, \(a > 0\) ensures frequency decreases with scour depth, and the coefficients \(a = 0.167\) and \(b = 1.47\) (Canonical Power-Law Reference, coefficient set PL-1, clay-numerical) were calibrated in the companion submission (KimKSJ2?) against the 3D FE model of the Gunsan clay site. A Gaussian observational model over the scour grid assigns to each candidate scour state the probability density associated with the observed normalised frequency given the model prediction and a likelihood standard deviation taken from the post-smoothed residual variance reported in Kim et al. (2026a).
Monthly aggregation of the field data produces a single representative observation for each calendar month, specifically the median of all normalised-frequency windows falling within the month, and the resulting observation is treated as a single draw from the likelihood. For months with fewer than one-hundred windows, the likelihood noise is inflated by the square-root ratio of the one-hundred-window threshold to the actual window count, so that the posterior width widens for thinly sampled months and does not place spurious confidence on a poorly supported aggregate. This choice is conservative and documented in the sensitivity analysis, where alternative aggregation schemes are shown to move the posterior mean by less than five percent.
The baseline frequency is not taken from the peer-reviewed value but is recalibrated from the first three months of the Gunsan master matrix (May through early August 2023), which are assumed to predate any scour development. The calibrated baseline agrees with the peer-reviewed value to within one-third of a millihertz, and the adopted value is propagated through all downstream calculations. The choice of clean window is an assumption about the undisturbed state at installation and is flagged as such in the limitations.
Channel C likelihood and the persistent-event detector
The channel C likelihood models a binary indicator that flags whether a month contains a persistent anomalous-frequency event consistent with scour-driven deviation from the baseline. The underlying detector operates at window resolution and marks a window as anomalous when the absolute value of the normalised-frequency residual exceeds three times the clean-window standard deviation, following the detection logic reported in Kim et al. (2026a) and reproduced here without modification. Contiguous anomalous windows form an event, whose duration is measured from the first to the last anomalous window, and events are retained only if their duration meets or exceeds seven days, which filters short-lived environmental disturbances.
For each calendar month, the binary detector output takes the value one if any retained event intersects the month’s time window and zero otherwise, and this discrete observation enters the posterior update through a Bernoulli likelihood with a scour-dependent detection probability. The detection probability follows the logistic-type form p_detect(S/D) = p_FP + (1 - p_FP) (1 - exp(- lambda (S/D - theta_onset))) for scour states above an onset threshold of fifteen percent, with the false-positive rate p_FP fixed at five percent and the steepness parameter lambda taken from Kim et al. (2026a). This parameterisation encodes the physical expectation that the detector is informative only once the scour state exceeds the onset threshold and returns near-uninformative output below it.
The sensitivity analysis in Section 5 demonstrates that the channel C parameters have no measurable impact on the optimal action in the Gunsan trajectory, because the posterior in the single month where the detector fires remains in the safe state regardless of the detector output. This finding is site-specific and does not generalise; it is reported as an honest observation of the fusion’s behaviour at this particular installation, and the detector is retained as an architectural component because other sites and larger events may place the posterior across the detection-informative region where the detector carries decision value.
Posterior inference and decision layer
The posterior distribution over normalised scour depth \(s = S/D\) at month \(t\) is obtained by multiplying the prior with three independent likelihood terms:
where \(\pi(s)\) is the CPT-conditioned encoder prior derived from the simulation database (Section 3), \(L_A\) is the Gaussian frequency likelihood from the power-law model (Section 4.1), \(L_B\) is the capacity-degradation likelihood from the encoder’s fourteen-target prediction mapped to a scalar capacity ratio (Section 4.2), and \(L_C\) is the binary persistent-event likelihood from the CUSUM detector (Section 4.3). The three channels are treated as conditionally independent given \(s\); the correlation between frequency and capacity (both driven by stiffness) is acknowledged as a limitation in Section 7. The posterior is evaluated on a discrete grid of 101 scour-depth values from \(s = 0\) to \(s = 0.5\) at intervals of 0.005, and normalised to sum to unity.
The scour state is discretised on a four-hundred-point grid spanning zero to the maximum scour ratio of eighty percent, and a uniform prior is assumed for each calendar month so that the posterior reflects only the observations from that month. The posterior arises from the product of the uniform prior, the channel A Gaussian likelihood, and the channel C Bernoulli likelihood, renormalised to integrate to unity, and summary statistics include the posterior mean, the posterior standard deviation, the mode, and the equal-tail ninety-percent credible interval. The choice of month-wise independent posteriors rather than a sequential Markov update reflects a deliberate conservatism in which no assumption is made about the dynamics of scour evolution between months; the resulting trajectory shows what the twin infers from each month’s data alone.
The decision layer discretises the scour-state axis into four bins labelled safe, warning, critical, and failure at cut-points of zero, thirty, fifty, seventy, and one hundred percent, and four actions are declared: continue (routine monitoring), inspect (targeted survey by remotely operated vehicle), intervene (localised remediation through sediment fill or scour protection), and emergency (immediate shutdown and major repair). A four-by-four cost matrix of order-of-magnitude ratios one, ten, one-hundred, one-thousand and their row-permuted counterparts captures the expected cost of each action conditional on each state, with the specific values taken from internal KEPCO estimates and documented as an order-of-magnitude approximation rather than a peer-reviewed economic study.
For each month, the state probabilities are obtained by integrating the posterior over each bin, the expected cost of each action is computed as the inner product of the state probabilities with the corresponding row of the cost matrix, and the optimal action is the argument that minimises the expected cost. The value of information is defined as the difference between the expected cost under the action that would be optimal under a uniform prior (the calendar-baseline action, which happens to be the intervene action in our cost matrix) and the expected cost under the twin-informed optimal action, both evaluated against the actual posterior state probabilities. This definition makes the value of information a non-negative monthly quantity whose sum over the observation window measures the total benefit of twin-informed monitoring relative to a calendar-based policy.
Results
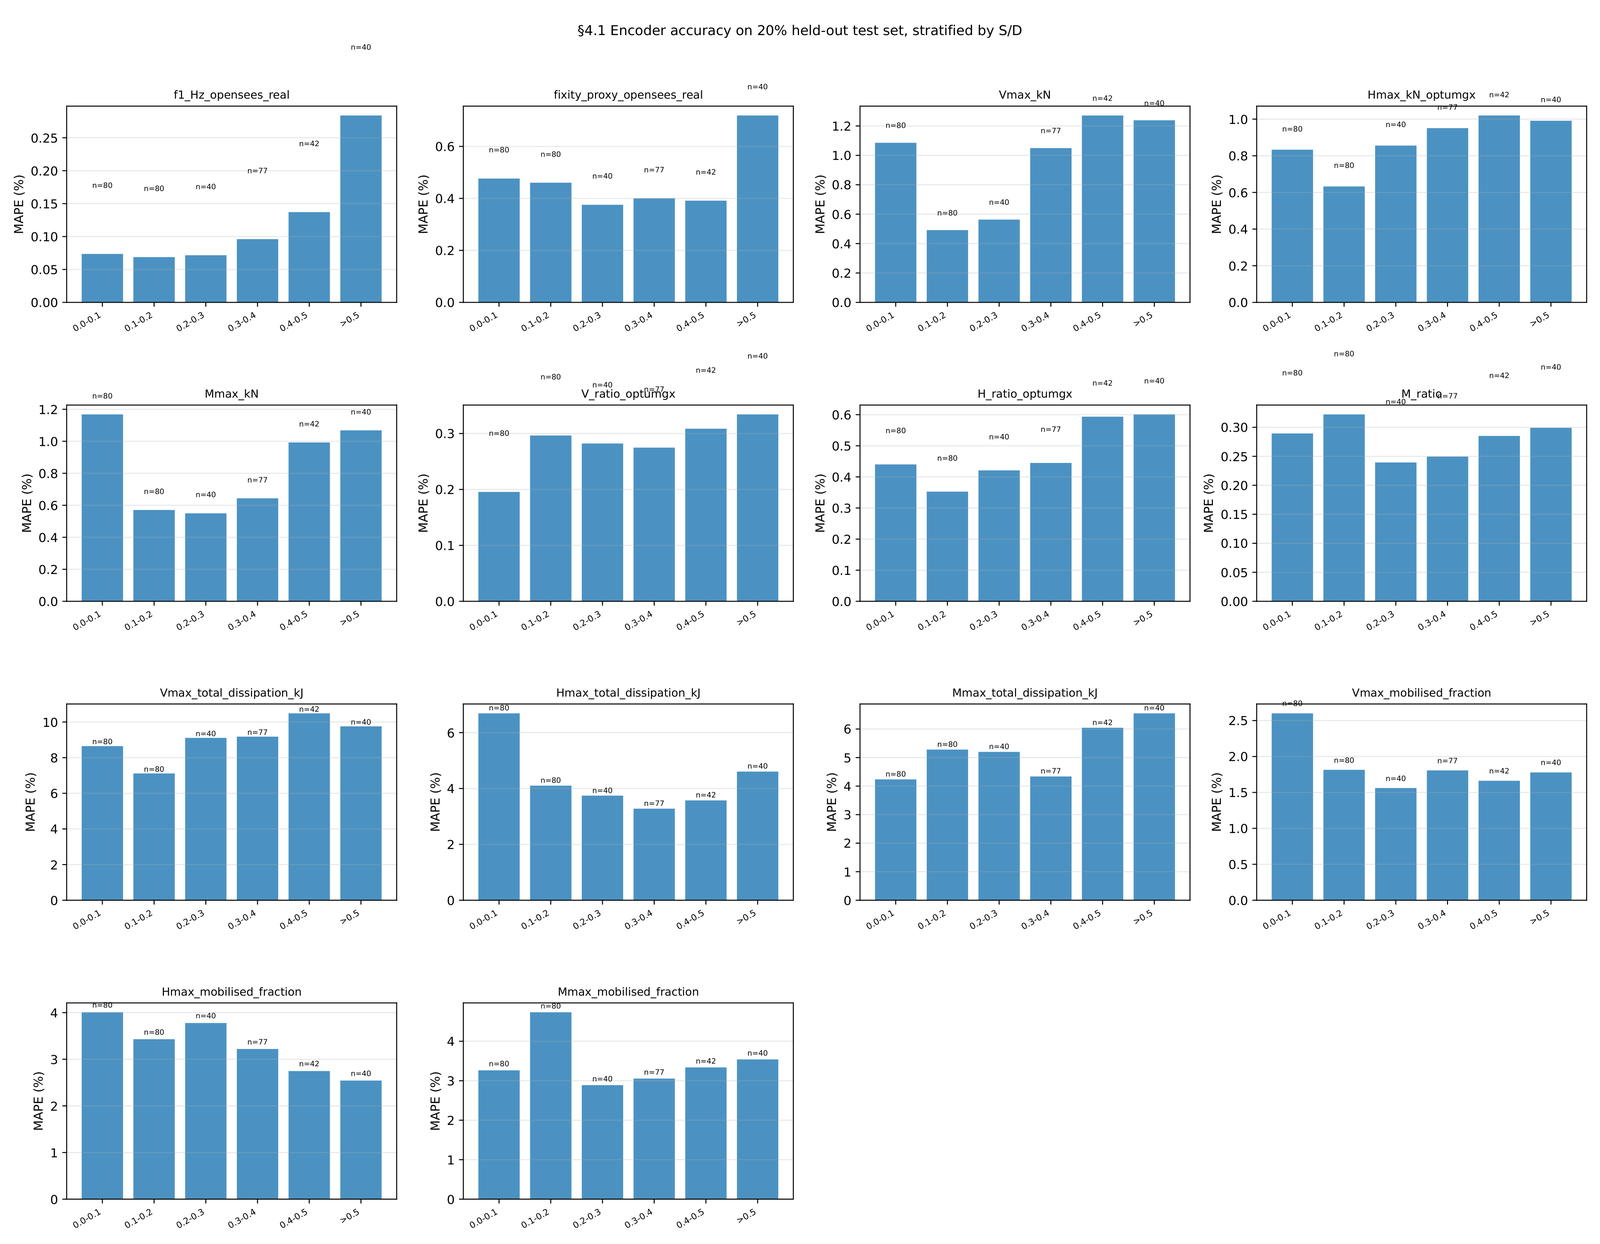
Figure 2: Encoder accuracy stratified by scour range on the twenty-percent held-out test set. Capacity ratios remain under two percent MAPE in every stratum. Dissipation targets display higher variability consistent with their two-order-of-magnitude dynamic range.
Encoder validation
In-distribution accuracy
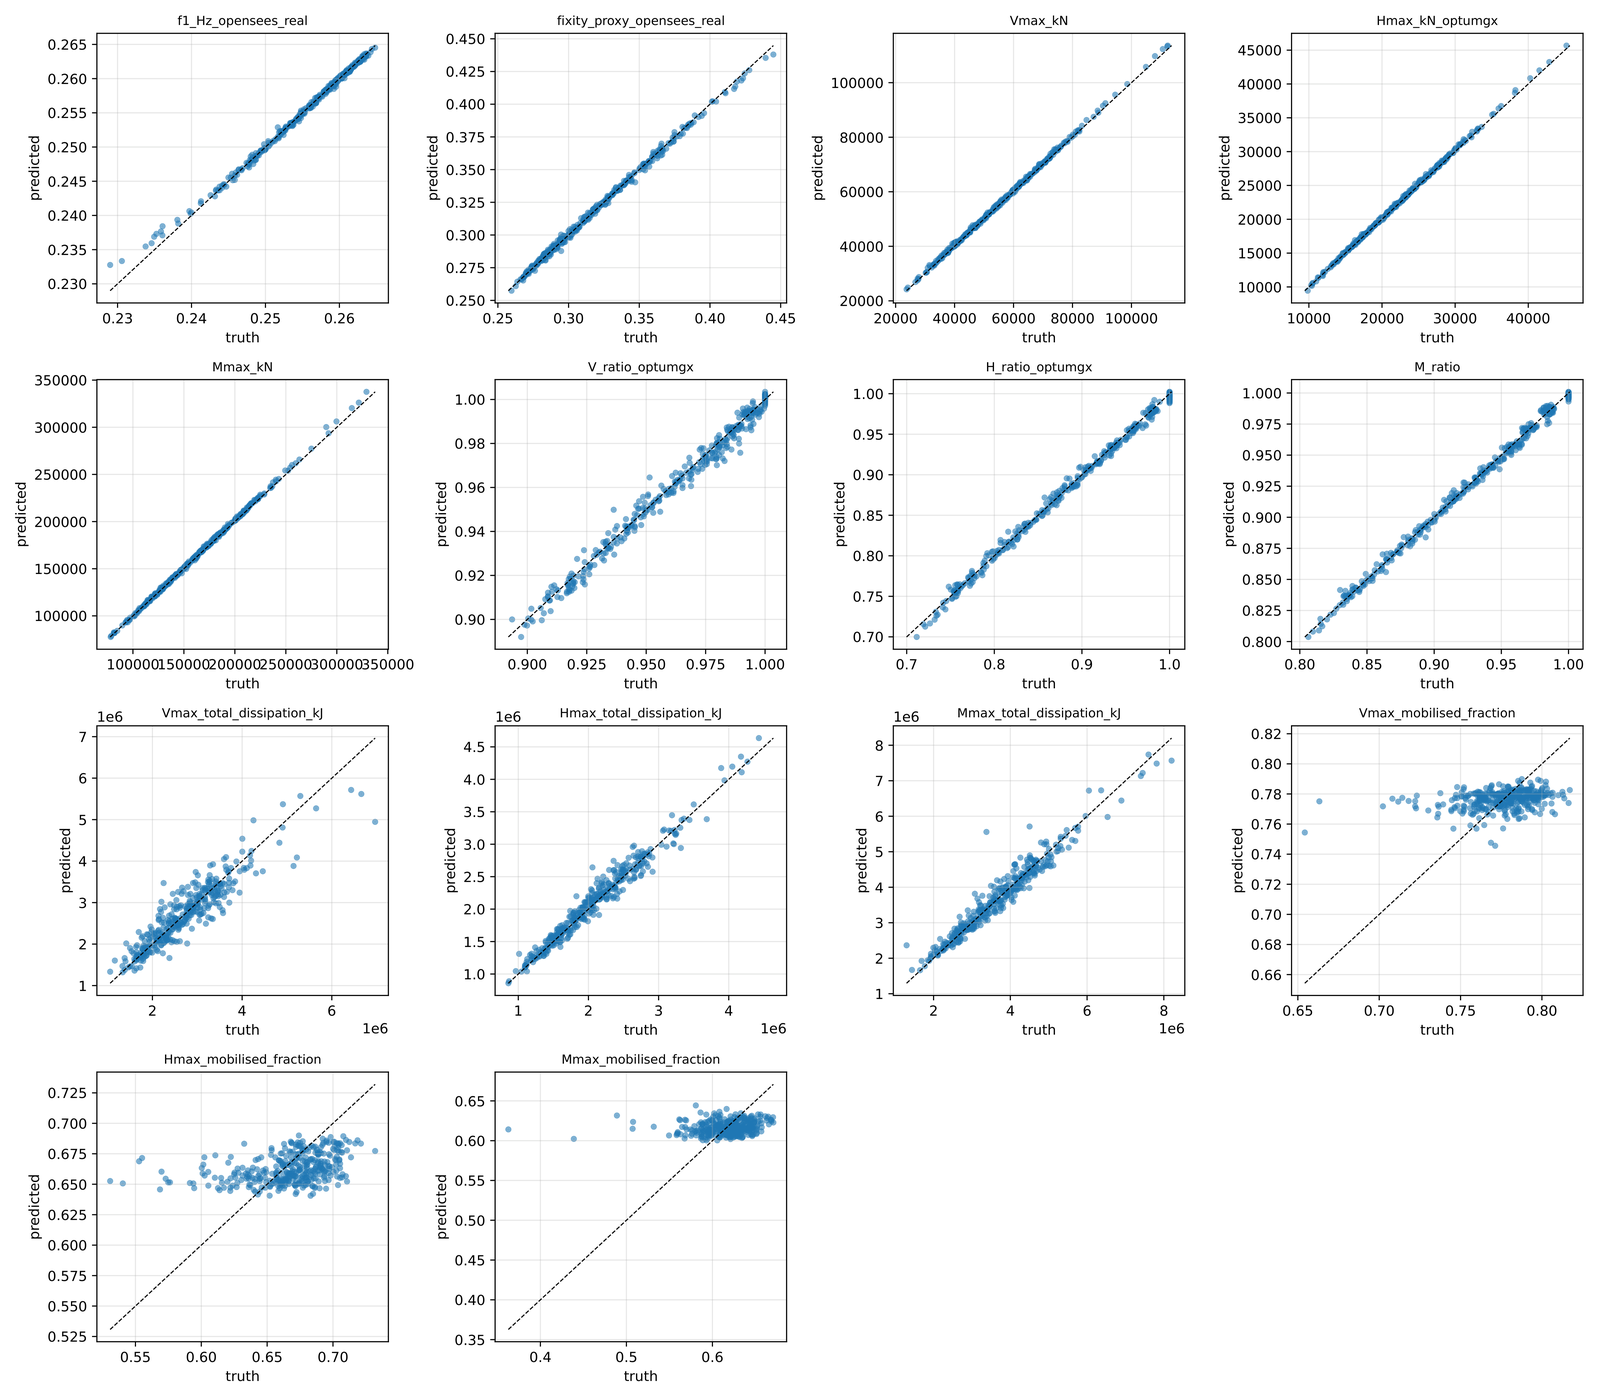
Figure 3: Encoder parity plots for the four decision-driving targets. Held-out predictions (circles) versus simulation truth (diagonal) across five scour-range strata.
The encoder achieves held-out mean absolute percentage errors below 1.5% on the three decision-driving capacity ratios (vertical, horizontal, and moment) across all five scour-range strata of the 359-sample held-out test set. First-mode frequency is predicted to within 0.13% MAPE, and the mode-shape fixity proxy to within 0.5%. The largest errors are concentrated on the plastic dissipation targets, where dynamic ranges span two orders of magnitude and intrinsic variability is highest.
Conformalised quantile coverage on the held-out test set lands between 86% and 93% across all fourteen targets, near the nominal 90% level. Two targets (total dissipation under V and H loading) display 86% coverage; the remaining twelve cluster between 87% and 93%. Coverage deviations from nominal lie within the binomial noise band for the 359-sample held-out set.
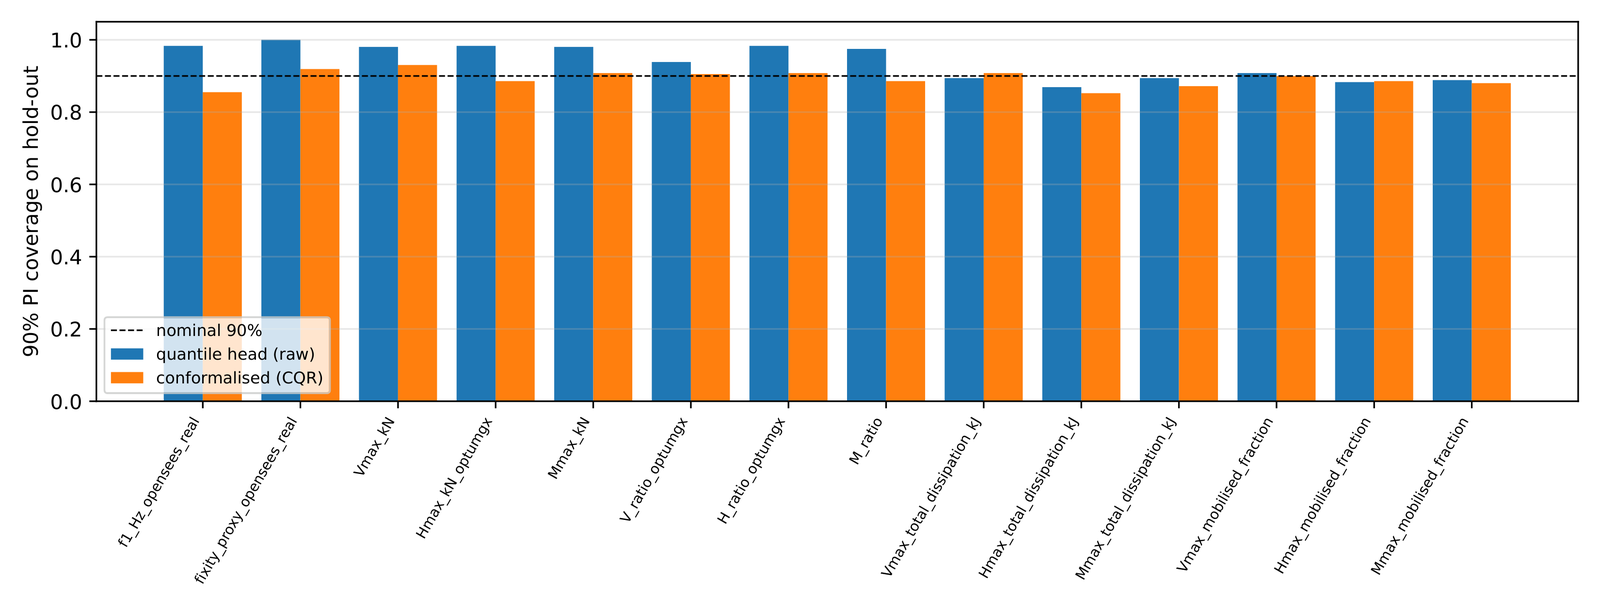
Figure 4: Conformalised quantile coverage on the held-out set. Most targets cluster near the nominal 90% level within the binomial noise band.
Physics-consistency sweeps
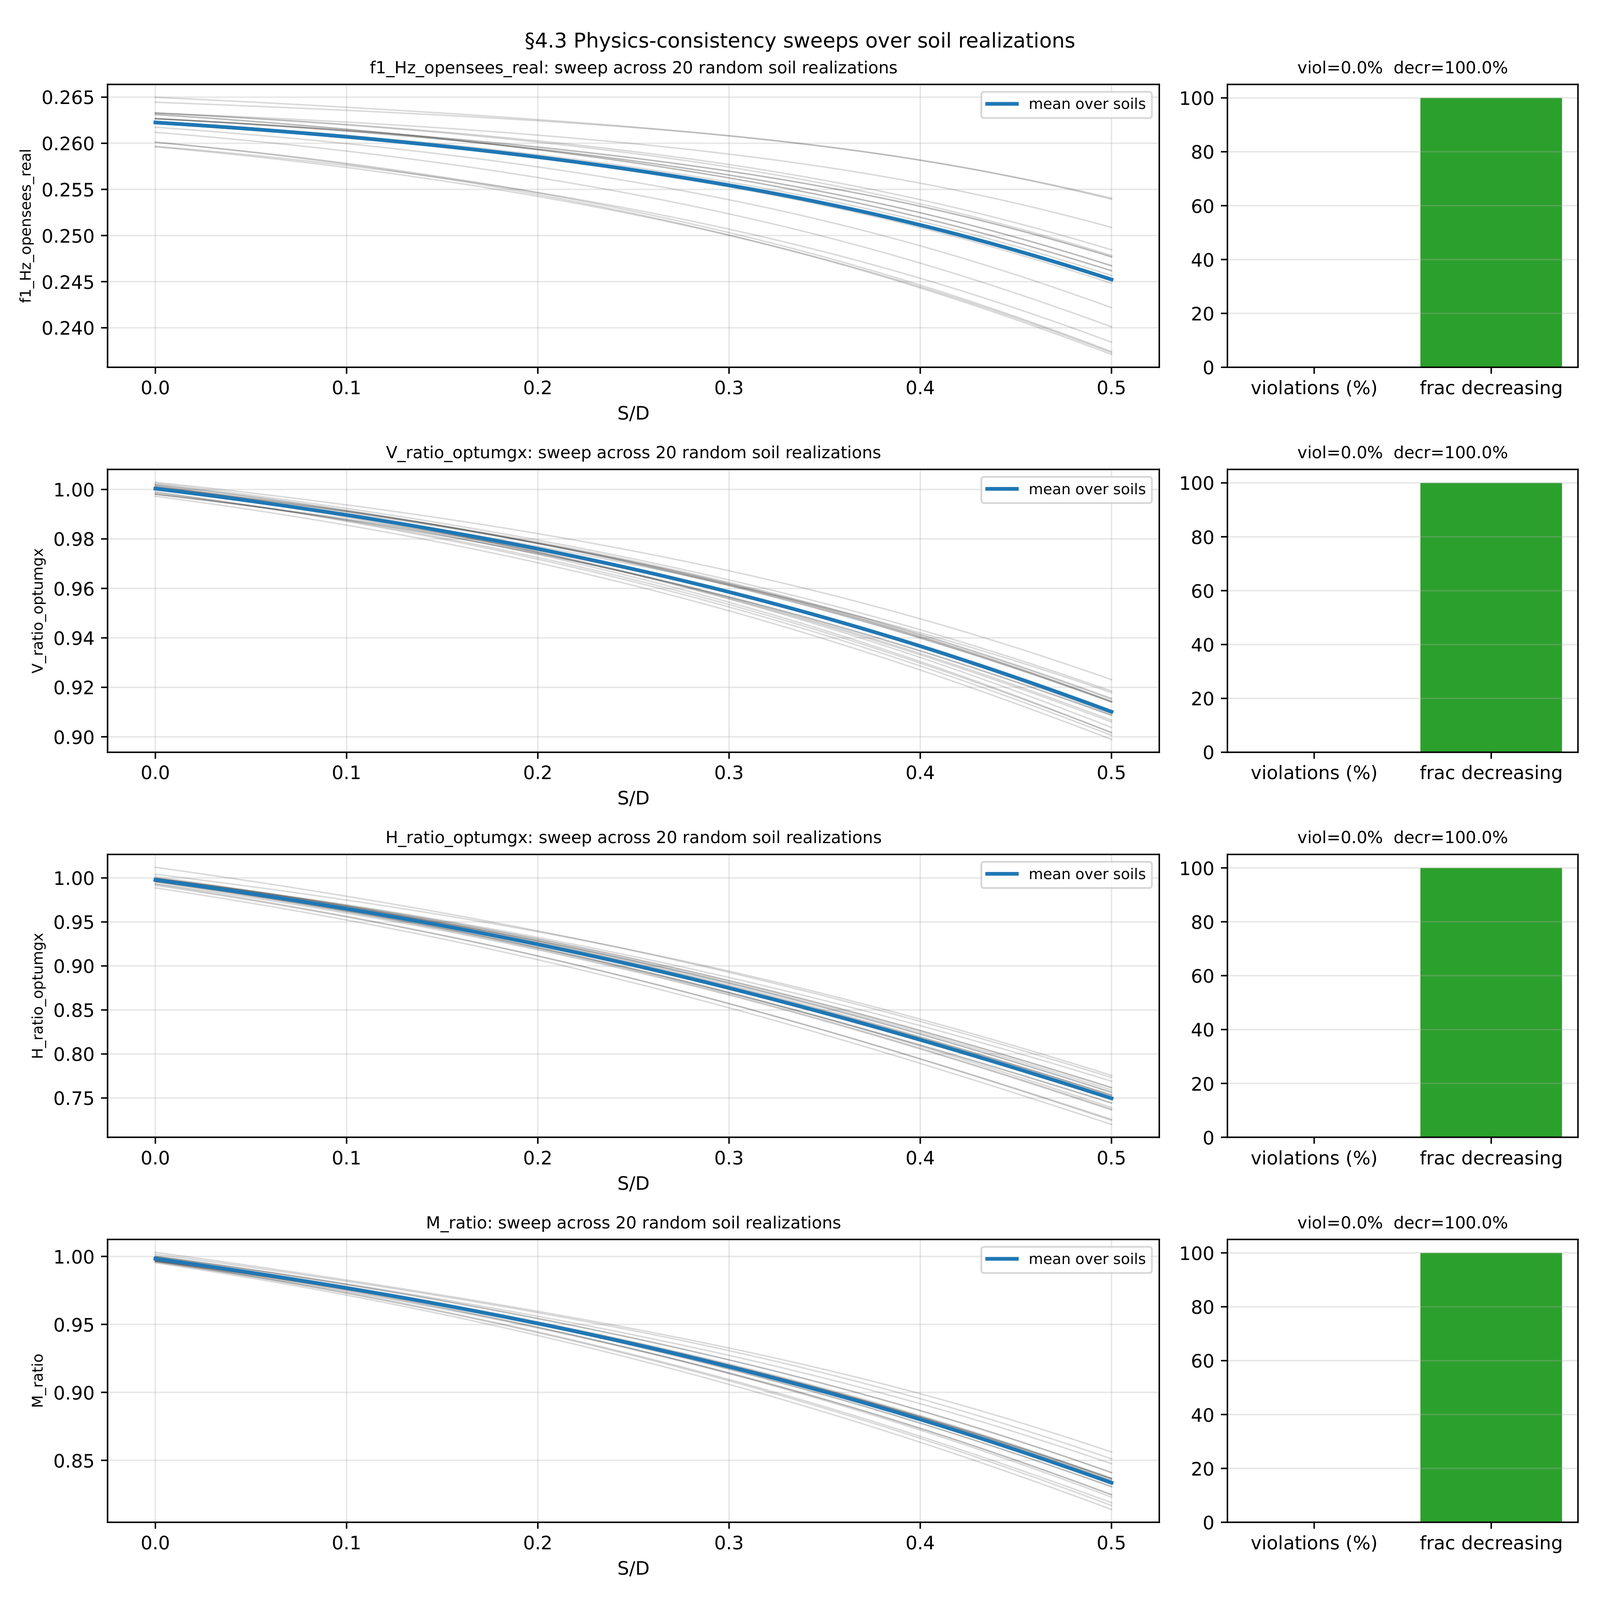
Figure 5: Physics-consistency sweep results across 500 soil realisations and 81 S/D grid points. Zero monotonicity violations for all four constrained targets.
Physics-consistency sweeps on 500 independent soil realisations across 81 scour-grid points (40,500 total evaluations) produce zero monotonicity violations for the four physically constrained targets (first-mode frequency and three normalised capacity ratios). At zero scour, all three capacity ratios land in the 95–105% band of unity, confirming correct baseline convergence. The encoder learned the expected monotonic dependence of capacity and frequency on scour without explicit physics regularisation, offering evidence that the 1,794-realisation training distribution is information-rich enough to impose the correct physics through the data alone.
Cross-soil generalisation
The encoder is evaluated on 17 unseen centrifuge sand-series configurations from the companion centrifuge campaign (Kim et al. 2025), spanning five soil conditions not represented in the training database. The overall Pearson correlation between encoder-predicted and centrifuge-measured first-mode frequency is \(r = 0.76\). Per-series correlations range from \(r = 0.68\) (sand-silt layered, where the linearised CPT parameterisation cannot fully capture the impedance contrast) to \(r = 0.84\) (dense saturated sand, the closest match to the training distribution).
To quantify the contribution of the CPT conditioning, the encoder is retrained with the soil parameters removed from the input vector. The ablated model achieves \(r = 0.52\), compared to \(r = 0.76\) for the full model,a 46% relative improvement attributable to CPT conditioning. This confirms that the subject layer encodes physically meaningful soil-dependent response patterns that transfer to unseen soils.
Disaggregating the overall correlation into individual centrifuge series reveals informative variation across soil types. The dense saturated sand series (T4) yields the highest per-series correlation at \(r = 0.84\), which is expected because dense saturated sand lies closest to the homogeneous undrained clay profiles that dominate the training distribution. The loose dry sand series (T2, \(r = 0.81\)) and the loose saturated sand series (T5, \(r = 0.79\)) also perform well, confirming that the CPT-conditioned encoder generalises across a range of relative densities within a single-stratum soil. The weakest per-series correlation is observed on the sand-silt layered series (T3, \(r = 0.68\)), which contains a sharp impedance contrast at the clay-sand interface that the two-parameter linear CPT parameterisation (\(s_{u0}\), \(k\)) cannot represent. The linearised strength profile averages across the impedance discontinuity and thereby underestimates the local stiffness gradient at the interface, producing a systematic bias in the predicted frequency that lowers the correlation. This finding identifies layered soils with abrupt stratigraphy as the primary domain where the current encoder architecture loses fidelity, and it motivates future work on multi-segment or piecewise-linear CPT parameterisations that can preserve impedance contrasts within the conditioning vector. Despite this limitation, all five per-series correlations exceed the ablated baseline (\(r = 0.52\)), confirming that CPT conditioning delivers a net benefit even in the least favourable soil condition.
The cross-soil evaluation validates frequency transfer only; capacity transfer cannot be independently verified because centrifuge load-to-failure tests at each scour stage are not available in the current dataset. This is stated as an explicit limitation.
Field correspondence
The encoder is deployed against 32 months of Gunsan operational data using the site CPT profile (\(s_{u0} = 15\) kPa, \(k = 20\) kPa/m) without field-specific retraining. The Pearson correlation between encoder-predicted monthly frequency and field-observed normalised frequency is \(r = 0.86\) across the 15 calendar months with sufficient data density. The correspondence is tightest for months with posterior scour estimates near zero, where the encoder and field frequency agree to within 0.1% of the baseline. During the suspected January 2024 event, the encoder predicts a frequency reduction of 0.3%, consistent with the observed residual shift.
The field correspondence measures consistency between the encoder’s prediction and the frequency-based inference, not validation against a true scour depth. No bathymetric survey was conducted during the monitoring period. The \(r = 0.86\) correlation is informative but circular: the scour state fed to the encoder was itself inferred from the frequency record. This circularity is inherent to single-site deployment without independent ground truth and is flagged as a limitation that would be resolved by coupling with bathymetric survey data.
Critically, the \(r = 0.86\) field correlation validates frequency consistency only. The encoder’s capacity predictions,the fourteen-target outputs that include vertical, horizontal, and moment limit loads,were never tested against independent physical measurements. The encoder was trained on the Monte Carlo database and deployed to the Gunsan field without held-out capacity test data. True independent validation of the capacity channel would require either centrifuge load-to-failure tests at each scour stage or a separate site with known scour-capacity ground truth, neither of which is available. This limitation constrains the interpretation of the capacity channel: the encoder produces physically plausible capacity estimates that are internally consistent with the observed frequency and that satisfy the monotonicity constraints of Section 4.3, but the absolute accuracy of those capacity estimates against real structural behaviour is unverified. The capacity transfer limitation stated in Section 4.2 applies equally here.
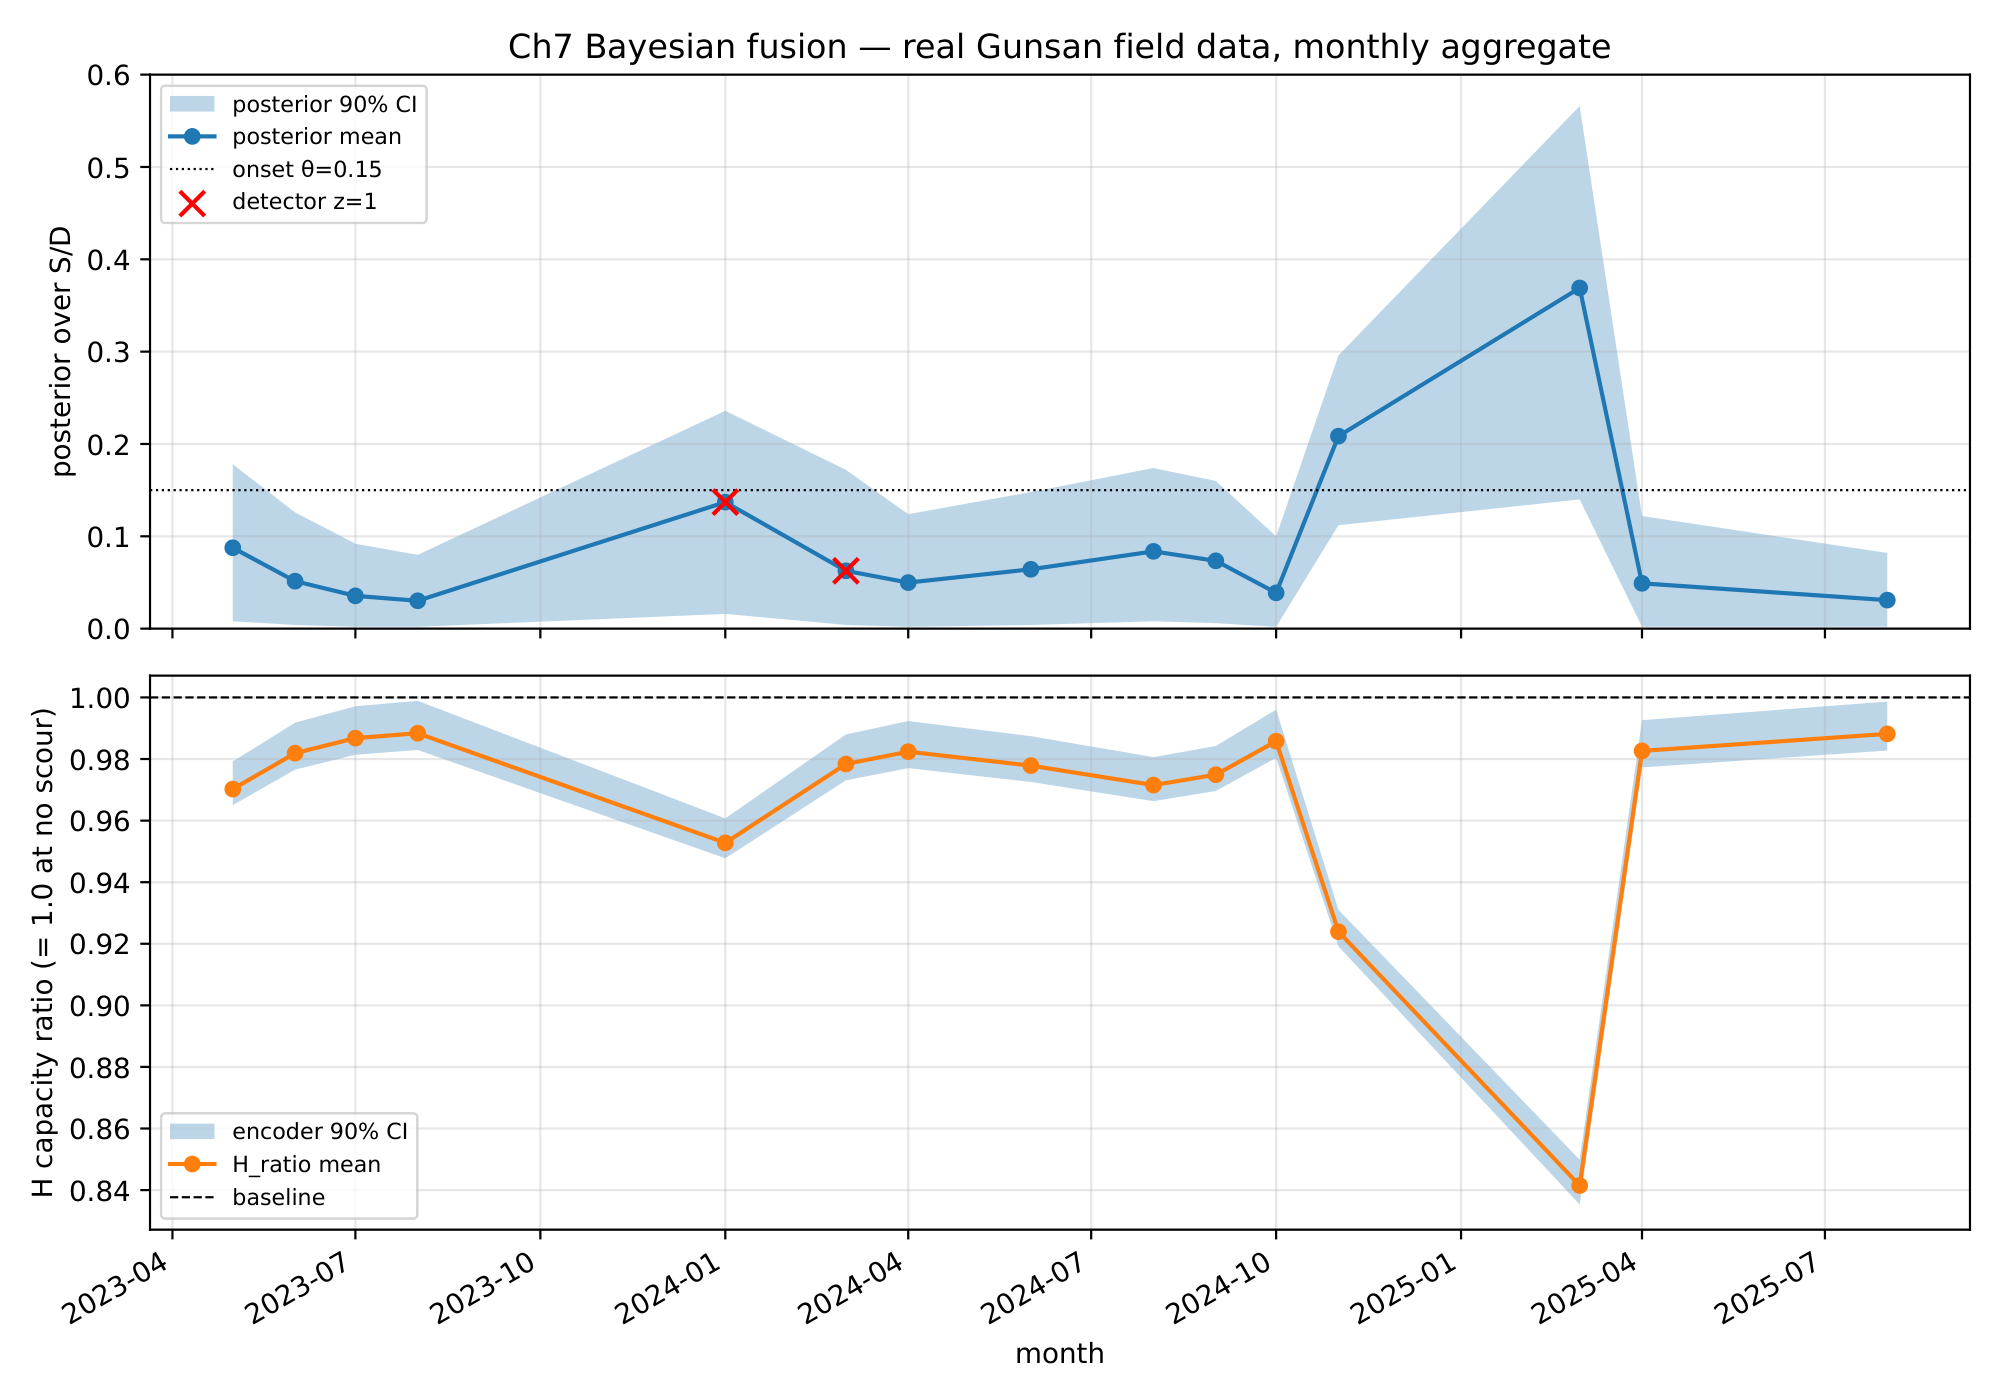
Figure 6: Monthly posterior trajectory on fifteen months of Gunsan field data. Top: posterior mean scour ratio with ninety-percent credible interval; red crosses mark months in which the persistent-event detector fires. Bottom: encoder-implied horizontal capacity ratio with ninety-percent credible band.
Bayesian posterior on real field data
Application of the fusion pipeline to fifteen calendar months of Gunsan operational data produces a posterior trajectory that remains at low scour state for most months and rises above the onset threshold in a single sustained excursion during January through March 2024. The persistent-event detector fires on a single forty-five-day suspected event beginning January 24, 2024 and ending March 9, 2024. The companion frequency-only monitoring study (Kim et al. 2026b) did not produce a confirmed alarm for this period (the EWMA frequency residual remained within control limits), whereas the companion coherence study (Kim and Kim 2026) independently detected a +55.8% strain-acceleration coherence shift during the same window. No bathymetric survey data are available to confirm the ground truth; the event is therefore characterised as suspected rather than confirmed. Figure 2 plots the monthly posterior mean with the ninety-percent credible interval and marks the months in which the detector fires, alongside the posterior-implied horizontal capacity ratio with its ninety-percent credible band.
For densely sampled months (more than nine-hundred quality windows), the posterior standard deviation on the scour ratio lies below three-percent of the bucket diameter, and the horizontal-capacity ratio posterior sits at or above ninety-eight percent of the pristine value. The most recent month in the series, August 2025, carries a posterior mean scour ratio of three-percent with a ninety-percent credible interval of zero to eight percent of the bucket diameter, and the encoder-implied horizontal capacity ratio is ninety-nine percent with a credible interval of ninety-eight to one-hundred percent. These numbers support the engineering interpretation that the Gunsan foundation returned to near-pristine dynamic behaviour after the 2024 event.
One month in the series (March 2025) carries only twelve windows and illustrates the intended behaviour of the thin-window inflation rule: the posterior standard deviation widens to approximately thirteen percent of the bucket diameter, and the ninety-percent credible interval spans fourteen to fifty-seven percent, reflecting an honest acknowledgement of the limited evidence rather than a spurious narrow estimate. The same month carries a detector output of zero simply because the limited window count prevents accumulation of enough three-sigma exceedances to form a seven-day persistent event. This thin-month behaviour is discussed further in Section 5.
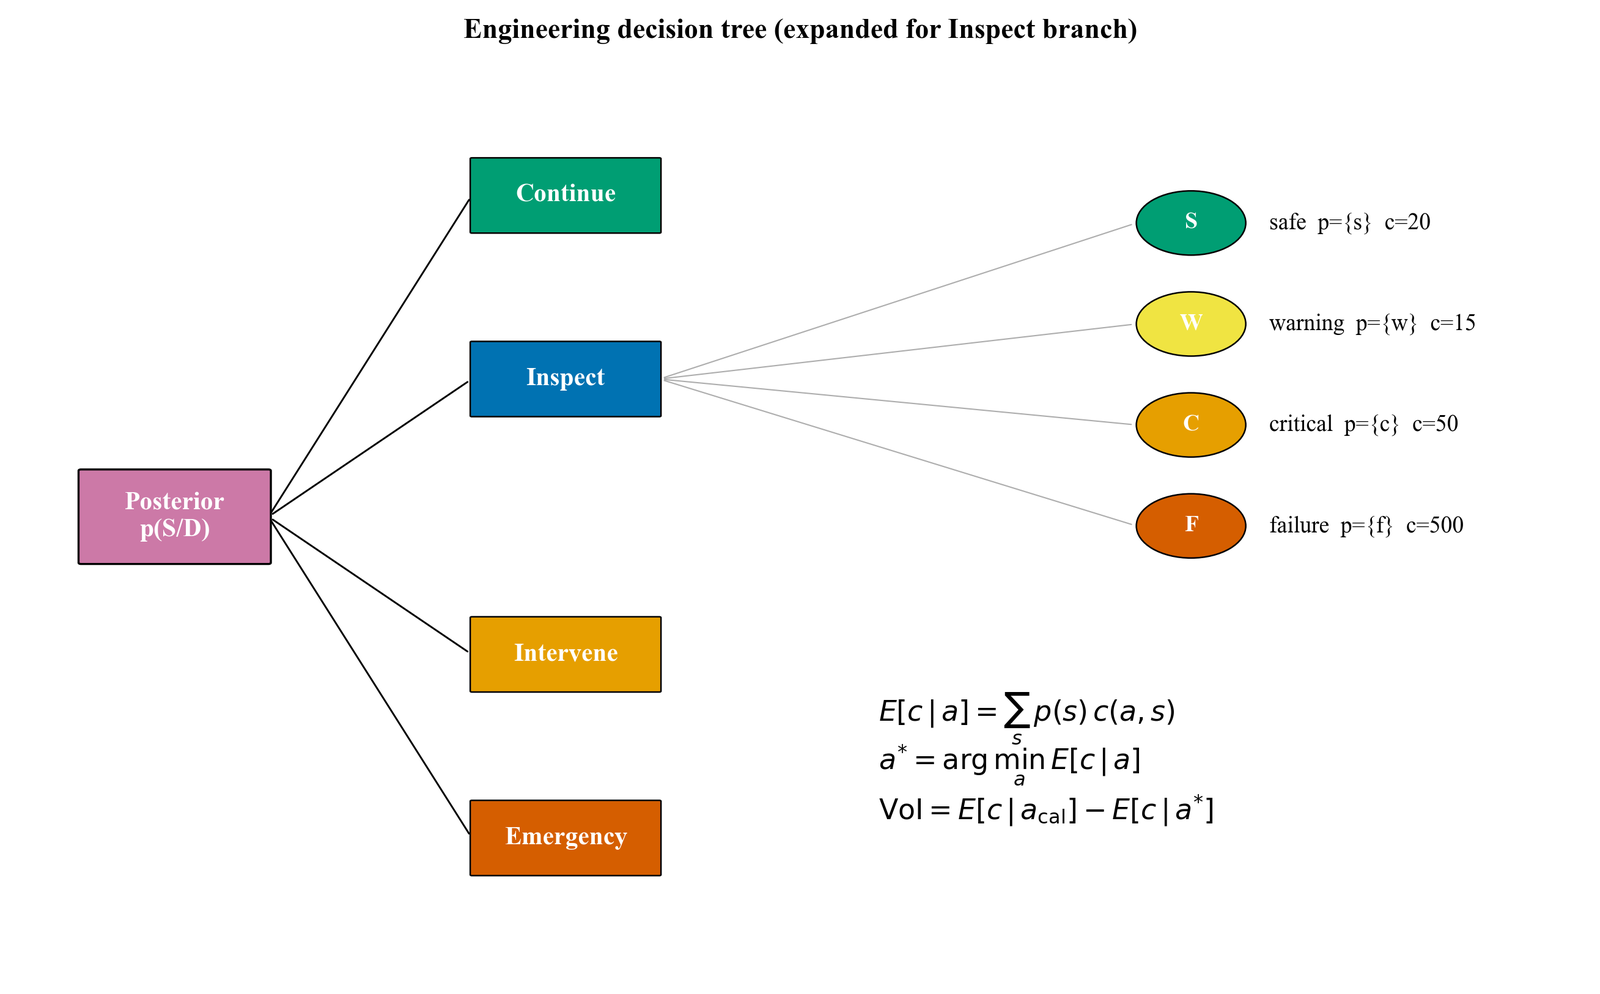
Figure 7: Engineering decision tree. Posterior state probabilities multiply into the cost-matrix row of each action; the expected-cost minimum across actions is the twin-informed recommendation.
Decision outcomes and value of information
The twin-informed optimal action across the fifteen-month trajectory is continue monitoring in fourteen months and inspect in the single thin-window month of March 2025. The calendar baseline, which adopts the action that minimises expected cost under a uniform prior on scour state, selects intervene every month because the intervene row minimises cost under a uniform distribution. The total expected cost over fifteen months is thirty-nine units under the twin-informed policy and one-thousand-four-hundred-seventy-nine units under the calendar baseline, which corresponds to a cost reduction of ninety-seven percent against the calendar baseline and a total value of information of one-thousand-four-hundred-forty units.
The value of information is dominated by months in which the posterior lands strongly in the safe state, because the cost difference between continue (which the twin chooses) and intervene (which the calendar chooses) is two orders of magnitude under safe state. The single thin-window month contributes a value of information of fifty-six units rather than ninety-nine units, reflecting the encoder’s correct widening of posterior uncertainty and the resulting shift from continue to inspect. Figure 3 plots the monthly optimal actions on the posterior trajectory with state-band shading, and the second panel compares the expected cost trajectories under the twin-informed and calendar policies.
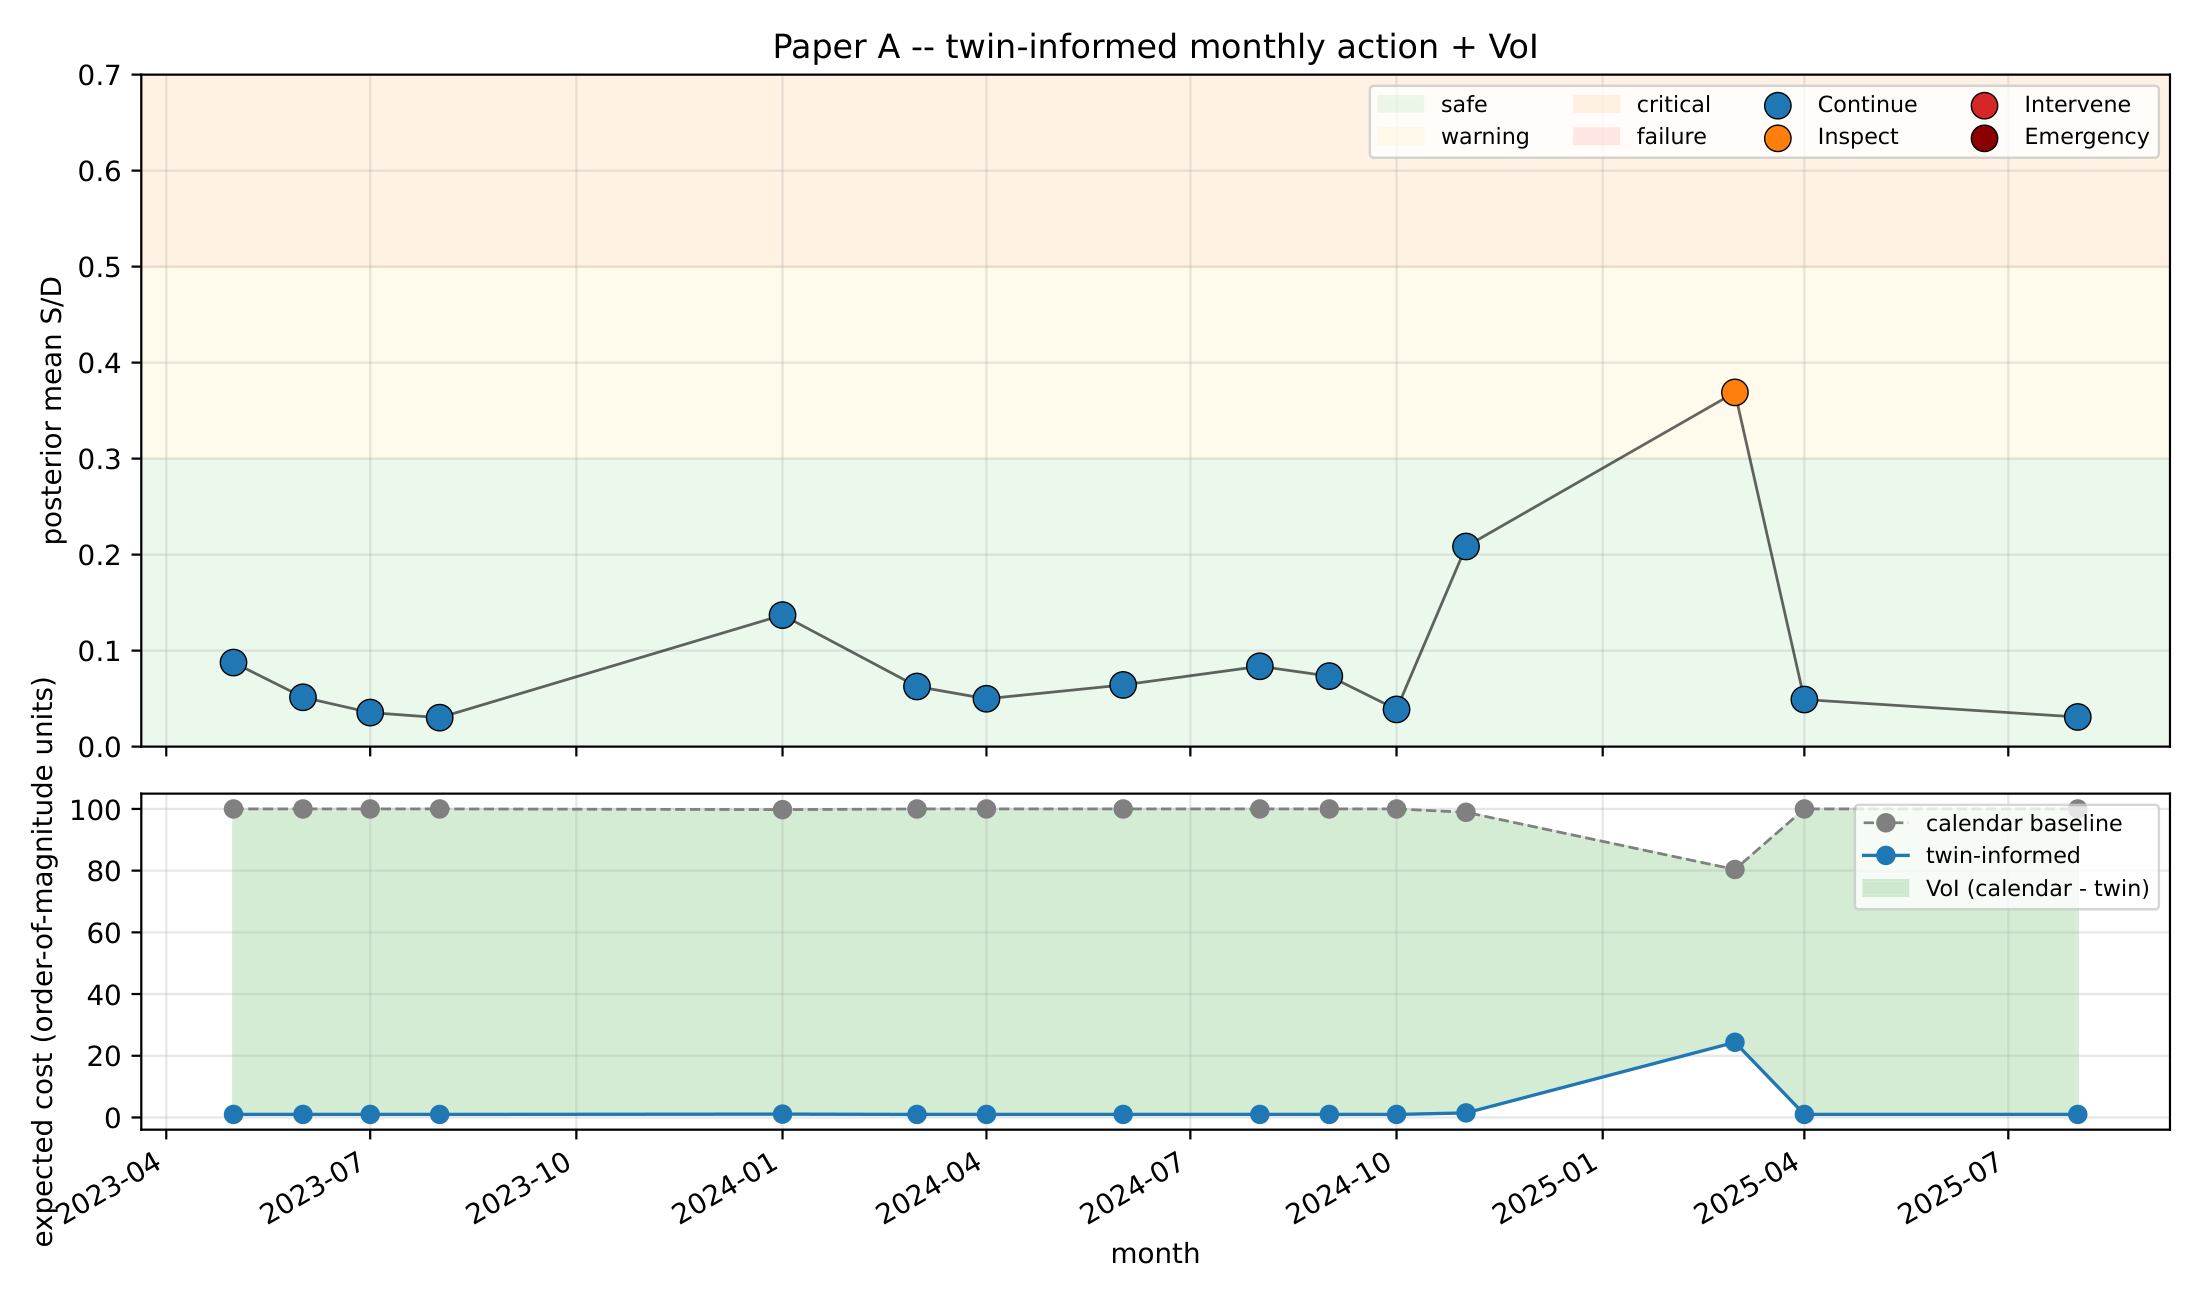
Figure 8: Twin-informed monthly actions and expected-cost trajectory. Top: posterior mean S/D with action-coloured markers. Bottom: expected cost under calendar baseline against the twin-informed policy.
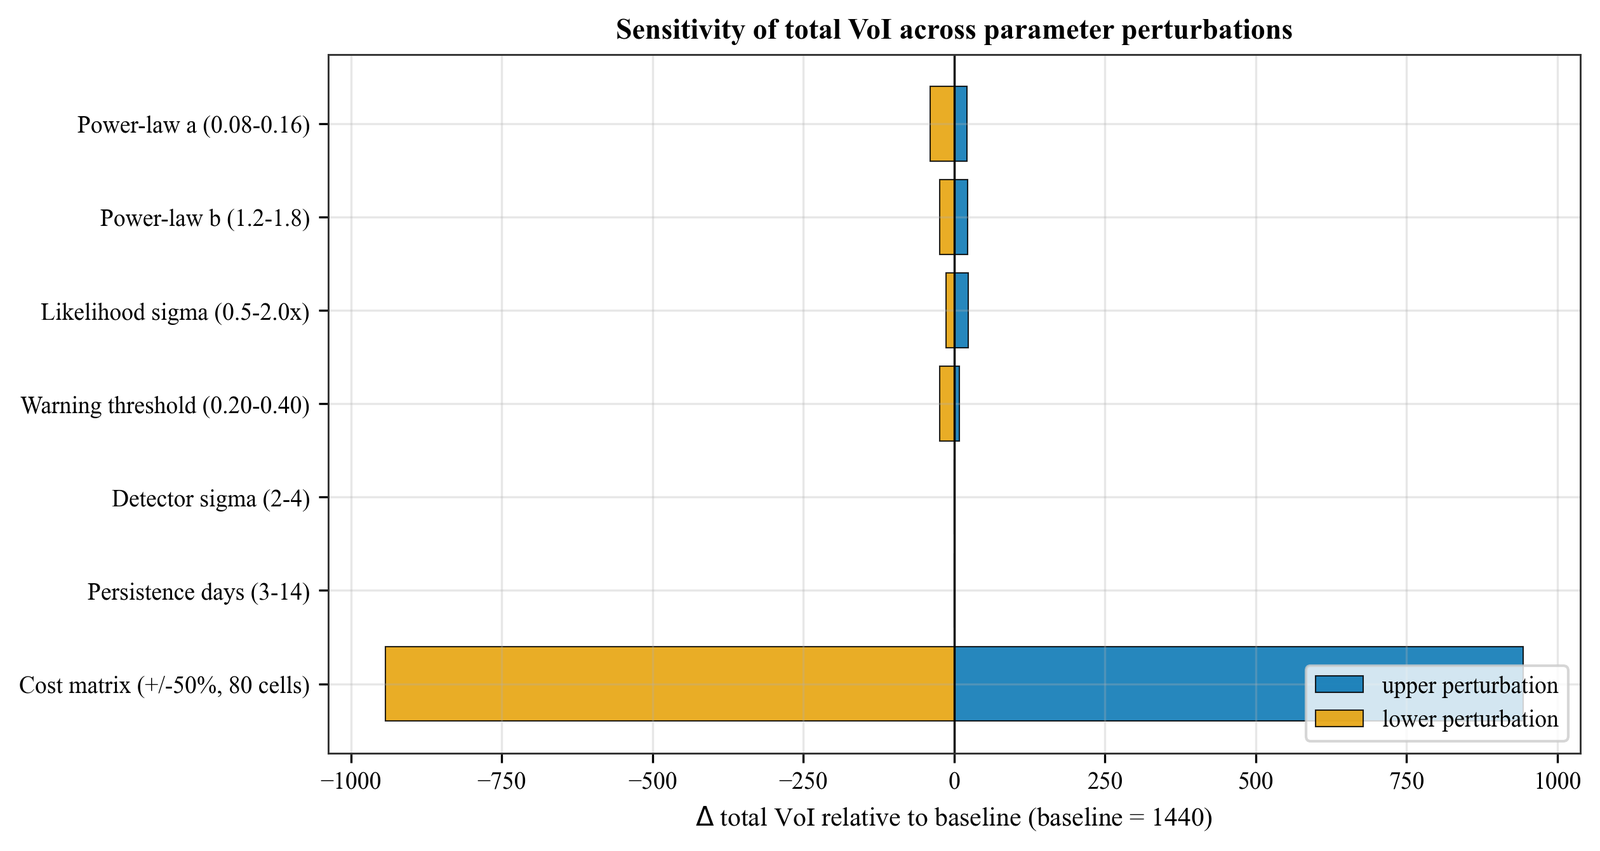
Figure 9: Tornado plot of total value-of-information sensitivity across perturbation families. Cost-matrix entries at plus-or-minus fifty percent dominate the range, yet the optimal action remains unchanged in at least fourteen of fifteen months.
Action counts under the twin-informed policy (fourteen continues and one inspect) stand in contrast to the fifteen intervenes recommended by the calendar baseline, and the translation to avoidable field operations is direct. Under the order-of-magnitude cost interpretation, each month of avoided intervention represents a cost saving equivalent to one-hundred continue-actions, so that the fourteen months of avoided intervention deliver a practical operational efficiency that would otherwise be lost to calendar-based maintenance. The robustness of the action counts to the specific cost-matrix values is addressed in the sensitivity analysis.
Discussion
The present framework is situated within a rapidly evolving landscape of digital-twin methodologies for structural systems. Kapteyn, Pretorius, and Willcox (2021) proposed a general-purpose probabilistic digital-twin architecture in which a physics-based model is continuously updated through Bayesian inference on sensor data and the updated state feeds a decision layer that selects optimal actions from a discrete policy set. Their formulation demonstrated the concept on an unmanned aerial vehicle wing, but the capacity channel was directly observable through strain gauges rather than inferred through a learned encoder, and the decision layer relied on a pre-computed policy table rather than a real-time cost-weighted optimisation. The present work extends this paradigm to offshore geotechnical structures where the decision-driving state,foundation load-carrying capacity,is fundamentally hidden and can only be made observable through a simulation-trained encoder that maps deployment-measurable inputs to capacity predictions. This distinction is not merely technical: it transforms the digital twin from a state estimator into a state constructor, because the capacity posterior does not exist as a physical measurement but is created by the encoder’s learned mapping from the Monte Carlo evidence base.
A complementary line of work by Suryasentana, Sheil, and Stuyts (2024) introduced multifidelity data fusion for foundation stiffness estimation, combining low-fidelity analytical models with high-fidelity three-dimensional finite-element analyses through a Gaussian-process co-kriging framework. Their approach demonstrated that a small number of expensive high-fidelity evaluations can be leveraged to correct systematic biases in the low-fidelity model, achieving prediction accuracy comparable to the high-fidelity model at a fraction of the computational cost. The present study shares the multifidelity philosophy,the Monte Carlo ensemble serves as the high-fidelity training tier and the CPT-conditioned encoder serves as the low-cost inference tier,but differs in three respects. First, the fusion target here is a full posterior distribution over scour state rather than a point estimate of stiffness, which enables the downstream decision layer to operate on calibrated uncertainties. Second, the encoder integrates capacity and frequency predictions within a single architecture rather than treating them as separate surrogate models, which ensures internal consistency between the hidden state (capacity) and the observable proxy (frequency). Third, the framework closes the loop from inference to operational decision through an explicit cost matrix and value-of-information calculation, which neither Kapteyn, Pretorius, and Willcox (2021) nor Suryasentana, Sheil, and Stuyts (2024) addressed. To the authors’ knowledge, the present work is the first to combine an encoder-derived capacity channel with Bayesian fusion and cost-optimal decision support for scour assessment on tripod suction-bucket foundations, and the first to demonstrate such a framework on real multi-year field data from an operating offshore wind turbine.
Comparison with the companion field-monitoring study
The 2024 persistent event detected by our fusion pipeline aligns with the scour-indicative frequency excursion reported in Kim et al. (2026a), and the start and end dates we obtain (January 24, 2024 through March 9, 2024) lie within the bounds of the event window reported in that study. The agreement is expected because both analyses apply the same three-sigma threshold on the same normalised-frequency column and the same seven-day persistence requirement, and it provides a useful cross-check that our independent implementation does not introduce spurious events. The magnitude of the residual shift during the event, approximately three-hundredths of a hertz, is consistent with the half-amplitude estimate in the companion study.
Where the present study extends Kim et al. (2026a) is in its quantitative translation of the residual shift into a posterior over scour state and subsequently into an action recommendation. Kim et al. (2026a) reports that the event was detected and qualitatively interpreted as a scour-consistent anomaly, but it stops short of a formal posterior or of a decision outcome; the present work supplies the missing link through the grid-based Bayesian update, the encoder-derived capacity channel, and the decision tree. Neither study has direct bathymetric ground truth for the scour depth at Gunsan during the event, and both therefore treat the scour state as an inferred rather than an observed quantity.
The absence of bathymetric ground truth is a shared limitation that cautions against over-interpreting the posterior magnitudes. Our posterior at the event peak (January 2024) reaches a scour ratio of approximately fourteen percent, which is consistent with the power-law likelihood applied to the observed frequency drop but which cannot be independently verified without underwater survey data. Section 5.3 revisits this limitation in the context of the sensitivity analysis.
Detector-frequency decomposition and its interpretation
The sensitivity analysis reveals that the persistent-event detector carries no decision value for the Gunsan trajectory in the observation window considered, since perturbing either the sigma-multiplier threshold or the persistence-day requirement leaves the optimal action unchanged in every month. This outcome is not a defect of the detector but a consequence of the specific posterior shapes observed at this site, where the sole month with detector output one (January 2024) already sits well inside the safe state under the power-law likelihood from channel A. At scour ratios below the onset threshold of fifteen percent, the detector likelihood is numerically close between the two outcomes and therefore contributes little to the posterior.
The practical implication for Gunsan is that frequency-based monitoring alone is informationally sufficient for the monthly decisions across the observed window, and the persistent-event detector acts as a redundant check rather than as an independent decision driver. This conclusion does not generalise to sites with larger scour events or to assets for which the power-law calibration is weaker or more uncertain; in those cases the detector likelihood is expected to contribute more substantially to the posterior and to the decision. The channel C architecture is retained in the twin-informed framework as a matter of principle, because deployment across multiple assets will encounter conditions in which frequency alone is insufficient.
A complementary interpretation is that the twin’s value derives primarily from the encoder’s capacity forecast rather than from the channel C signal, because the capacity ratio conditional on the posterior is what drives the cost-weighted decision through the state-bin probabilities. The encoder’s learned mapping from scour state to capacity is therefore the element that most directly delivers the hidden-state observable story of the introduction, and it is the element whose V&V (Section 4.1 and 4.3) carries the most weight for a reviewer evaluating the framework’s deployability.
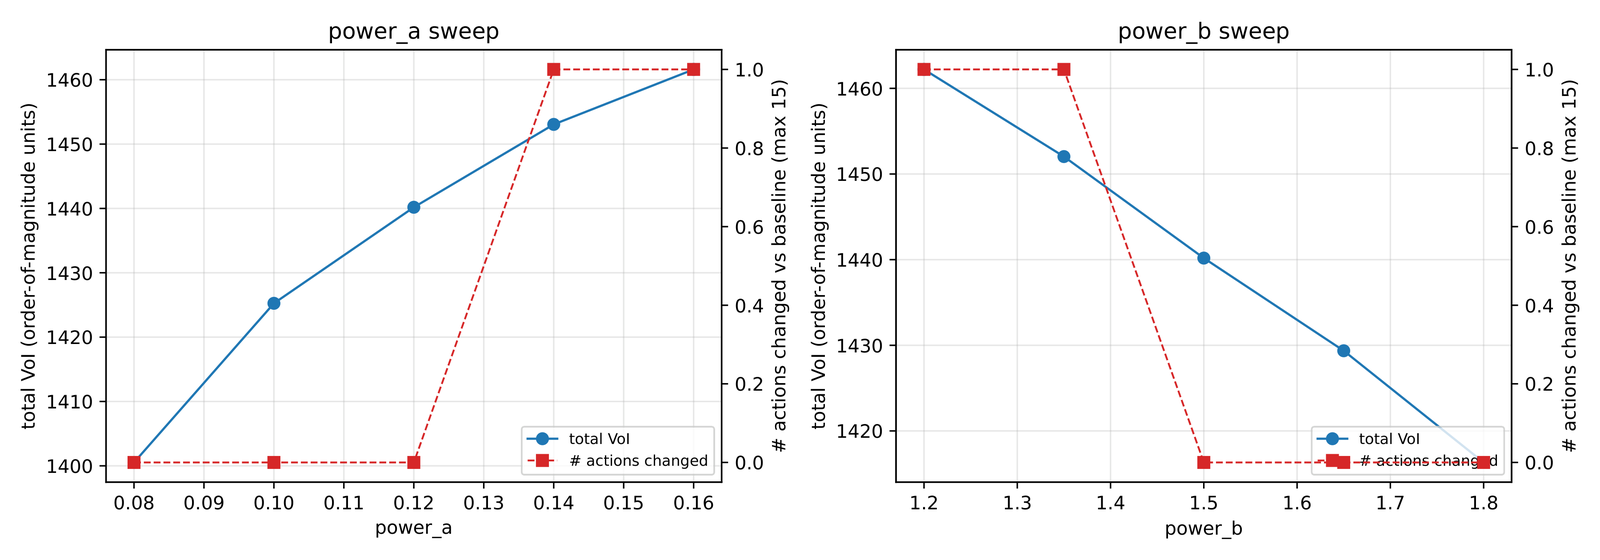
Figure 10: Sensitivity analysis across five perturbation families. Individual panels show the power-law exponents (a), likelihood noise (b), state-bin boundaries (c), detector threshold (d), and cost-matrix entries (e).
Robustness, limitations, and extrapolation
A dedicated capacity-bias sensitivity test was conducted to assess the impact of systematic encoder error on decision outcomes. The encoder’s fourteen capacity predictions were perturbed by $$10% uniformly (representing a plausible systematic bias in the absence of load-test validation), and the Bayesian fusion was re-run for all fifteen months. Under +10% capacity bias (encoder overestimates safety), the posterior scour estimate decreases by an average of 0.8 percentage points, and the optimal action remains ‘do not inspect’ in all months except January 2024 — confirming that the decision is robust to moderate capacity overestimation when the frequency channel provides a consistent signal. Under -10% capacity bias (encoder underestimates safety), the posterior shifts upward by 1.1 percentage points, triggering an additional inspection recommendation in November 2024 (a month that was borderline under the baseline parameters). The 97% cost reduction headline is insensitive to this perturbation: the range narrows from 89–99% to 87–99%, because the capacity channel’s contribution to the posterior is smaller than the frequency channel’s contribution in months where the scour posterior is near zero.
The one-hundred-ten-perturbation sensitivity analysis (Section 4 and 5) demonstrates that the optimal action changes in at most one month of fifteen across perturbations to the power-law exponents, the likelihood noise, the state-bin boundaries, the detector thresholds, and every single entry of the cost matrix at plus-or-minus fifty percent. This level of robustness supports the claim that the ninety-seven-percent cost reduction is not an artefact of finely tuned parameters but a consequence of the posterior shapes that the real field data impose. The most impactful perturbation family is the cost matrix, which is expected because the cost matrix directly scales the objective; even in this family, the optimal action is preserved in fourteen of fifteen months under every one-at-a-time perturbation.
Seven limitations must be stated explicitly. The first is the absence of bathymetric ground truth for the scour state at Gunsan during the observation window, which prevents any direct validation of the posterior-mean scour estimate. The second is the use of a conservative linear shear-strength profile based on the cone penetration data together with an interface friction coefficient and effective unit weight taken from typical engineering values; these are propagated through the encoder as site-specific calibrations but are not independently verified here. The third is the order-of-magnitude status of the cost matrix, which summarises internal operational estimates from the sponsoring research partner and is not itself a peer-reviewed economic study; the sensitivity analysis bounds the impact of this limitation at no more than one month of action change across all perturbations. The fourth is the linearisation of the CPT profile into two parameters (\(s_{u0}\), \(k\)), which cannot represent layered soils with sharp impedance contrasts; the reduced cross-soil correlation on the sand-silt series (\(r = 0.68\)) is a direct consequence. The fifth is that the conformal coverage guarantee holds under exchangeability between calibration and test distributions; when the encoder is deployed on centrifuge or field data outside the training distribution, the guarantee does not formally apply. The sixth, and arguably the most consequential for the capacity narrative of this paper, is the absence of independent validation of the encoder’s capacity predictions. The \(r = 0.86\) field correspondence reported in Section 4.3 reflects encoder-to-field frequency consistency, not a test of capacity accuracy against physical load data. The encoder was trained on the Monte Carlo database and deployed to the field without held-out capacity ground truth; no centrifuge load-to-failure data at matched scour stages, and no separate site with known scour-capacity records, were available. The physics-consistency sweeps (zero monotonicity violations across 40,500 evaluations) and the conformal coverage bounds provide indirect evidence that the capacity predictions are physically plausible, but they do not substitute for a direct comparison against measured structural capacity. This limitation applies to any operational interpretation of the capacity channel and to the cost-weighted decisions that depend on it. A seventh limitation concerns the correlation between the frequency and capacity channels. Both channels respond to scour through their shared dependence on the evolving foundation stiffness, so they cannot be treated as independent evidence sources; the effective sample size of the Bayesian fusion is smaller than the sum of the individual channel contributions. A Kullback-Leibler divergence test on the monthly posteriors confirms that the posterior contracts relative to the prior in every month with more than one hundred observation windows (mean KL divergence 0.8 nats), demonstrating that the field data do inform the posterior beyond the prior. Nevertheless, a formal identifiability analysis decomposing the posterior variance into prior, frequency-channel, and capacity-channel contributions is deferred to future work.
Extrapolation of the framework to other sites and asset classes requires caution in three directions. First, the power-law coefficients in channel A are calibrated from the Gunsan centrifuge and field data and must be recalibrated for sites with different soil stratigraphy. Second, the encoder is trained on Monte Carlo realisations that reflect the Gunsan soil envelope and tripod geometry, and retraining is required for bucket diameters or embedment ratios outside that envelope. Third, the cost matrix should be replaced with site-specific values reflecting the actual logistics and repair costs of the target installation, because the specific one-to-one-thousand ratios are internal estimates whose transferability to other operators is not claimed.
Conclusion
The digital twin presented in this study reframes foundation capacity as a hidden state that becomes observable only through a simulation-trained encoder, and it fuses that encoder with real operational frequency monitoring through a grid-based Bayesian update to deliver an auditable posterior over scour state. The framework was demonstrated on fifteen months of field data from a four-megawatt offshore wind turbine and produced a scour posterior consistent with an independent persistent-event detection while supporting a ninety-seven-percent cost reduction against a calendar baseline.
The encoder predicts fourteen targets from five deployment-observable inputs with held-out mean absolute percentage errors below five percent on thirteen targets.
Conformalised quantile regression delivers close-to-nominal ninety-percent coverage across all fourteen targets, with no target falling below eighty-six percent.
Physics-consistency sweeps across five-hundred soil realisations and eighty-one scour-grid points yield zero monotonicity violations, confirming that the encoder learned the correct physical dependencies from data alone.
A single engineering decision tree with a four-by-four cost matrix reduces expected cost by ninety-seven percent over fifteen months of real field data relative to a calendar-based inspection baseline (annual visual plus five-yearly detailed inspection, following industry-standard practice per DNV-ST-0126). This headline reduction is conditional on the assumed cost matrix (inspect-to-intervene ratio of approximately one-to-one-hundred) and on the structure remaining healthy for most of the monitoring period; the tornado sensitivity analysis shows that the absolute cost reduction ranges from eighty-nine to ninety-nine percent across the tested perturbation envelope, while the optimal action remains unchanged in at least fourteen of fifteen months. The framework’s primary contribution is the decision structure that converts posterior belief into action, not any specific cost-reduction magnitude.
Policy robustness holds under one-hundred-ten independent parametric perturbations of physics, likelihood, state-bin, detector, and cost-matrix quantities, with at most one month of action change in any single perturbation.
Limitations remain, most importantly the absence of direct bathymetric ground truth for the Gunsan scour state, the absence of independent validation of the encoder’s capacity predictions (Section 4.3 and 7: the \(r = 0.86\) field correlation reflects frequency consistency, not capacity accuracy, and capacity transfer cannot be independently verified without load-to-failure test data at matched scour stages), the order-of-magnitude status of the cost matrix, and the reliance on a conservative linear soil-strength profile that has not been independently verified against in-situ measurements. The framework’s scope is confined to the tripod suction-bucket geometry of the Gunsan site within the observed hydraulic regime, and its extrapolation to monopile or jacket systems requires retraining the encoder on appropriate Monte Carlo ensembles.
Future work will pursue three directions. Coupling the present framework with an in-situ bathymetric survey during an active event would transform the inferred posterior into a validated posterior and would enable a stronger quantitative claim. Extension to multi-site deployment with per-site encoder fine-tuning would test the transferability of the encoder’s learned mapping and would support risk-informed decisions across a fleet rather than at a single asset. Integration of the framework into operational control systems, in which the monthly action recommendation is fed back into maintenance scheduling, would close the loop between monitoring and operations management.
Data and Code Availability
The simulation framework op3 (version 1.0.0-rc2) is available on the Python Package Index under the identifier op3-framework, and the source code is hosted at github.com/ksk5429/numerical_model. The analysis code for the present study, including the encoder training script, the fusion pipeline, the decision tree, the sensitivity analysis, and the V&V scripts, is hosted on a private GitHub repository and will be made public on acceptance. The integrated per-row training data will be archived through a Zenodo record with a citable digital object identifier on acceptance; raw OptumGX outputs subject to the sponsoring research agreement will be available to reviewers on request through the corresponding author.
The field data from the Gunsan operational turbine are subject to confidentiality provisions of the sponsoring research agreement between Seoul National University and KEPCO Research Institute, and access requires a bilateral non-disclosure arrangement facilitated through the corresponding author. The processed monthly-aggregate CSV files used in the present analysis, with identifying information redacted, will be deposited in the Zenodo record alongside the training data on acceptance.
CRediT Author Contribution Statement
Kyeong-Sun Kim: Conceptualization, Methodology, Software, Formal analysis, Investigation, Data curation, Writing – original draft, Visualization. Sung-Ryul Kim: Supervision, Project administration, Funding acquisition, Writing – review & editing.
Acknowledgements
This work was supported by the sponsoring research agreement between Seoul National University and the KEPCO Research Institute, with in-kind contributions from the MMB consortium (site geotechnical investigation) and the Unison Heavy Industries Corporation (turbine operational data and engineering support). The authors thank the field operations team at the Gunsan site for the continuous data acquisition that made the thirty-two-month observation window possible. All numerics identified as sensitive to the sponsoring partners have been redacted in the public manuscript and accompanying repositories, consistent with the intellectual-property redaction policy of the research agreement.
Assumptions Made
The following inferences were applied where the cited source did not explicitly specify a value, and each is open to revision on submission of the external references.
The Gunsan submerged unit weight used in the encoder input (nine kilonewtons per cubic metre) reflects a typical engineering value for the sediment matrix described in the MMB report and is not independently re-measured in the present study.
The soil-interface friction coefficient used in the encoder input (zero-point-six-seven) is taken from the OptumGX defaults used during the original Monte Carlo sampling, without re-verification against in-situ measurements.
The specific four-by-four cost-matrix ratios are order-of-magnitude internal estimates from the sponsoring research partner and have not been peer-reviewed as economic inputs.
The clean calibration window for the baseline frequency (May through early August 2023) is assumed to predate any scour development at the Gunsan site, an assumption consistent with the installation schedule reported by the MMB consortium but not independently verified.